General Guidelines
This chapter describes common principles and behaviors shared across all historical reports. These guidelines apply regardless of the specific report type or displayed metrics and help users better understand how to work with historical data effectively.
Report Types
Historical Reporting includes two main types of reports.
Interactive Reports
Interactive Reports are Power BI reports designed primarily for interactive data exploration and analysis.
They typically include:
Charts
Tables or matrices
KPIs
Interactive elements such as buttons and drill-through actions
Interactive Reports allow users to analyze trends, compare metrics, and navigate between related views using drill-through functionality.
Paginated Reports
Paginated reports are optimized for structured output and exporting.
Key characteristics:
Data is distributed across multiple pages
Layout is optimized for printing and offline sharing
Limited interactivity compared to Interactive Reports
Uses a report-specific parameter-based filtering mechanism
Filtering Behavior Summary
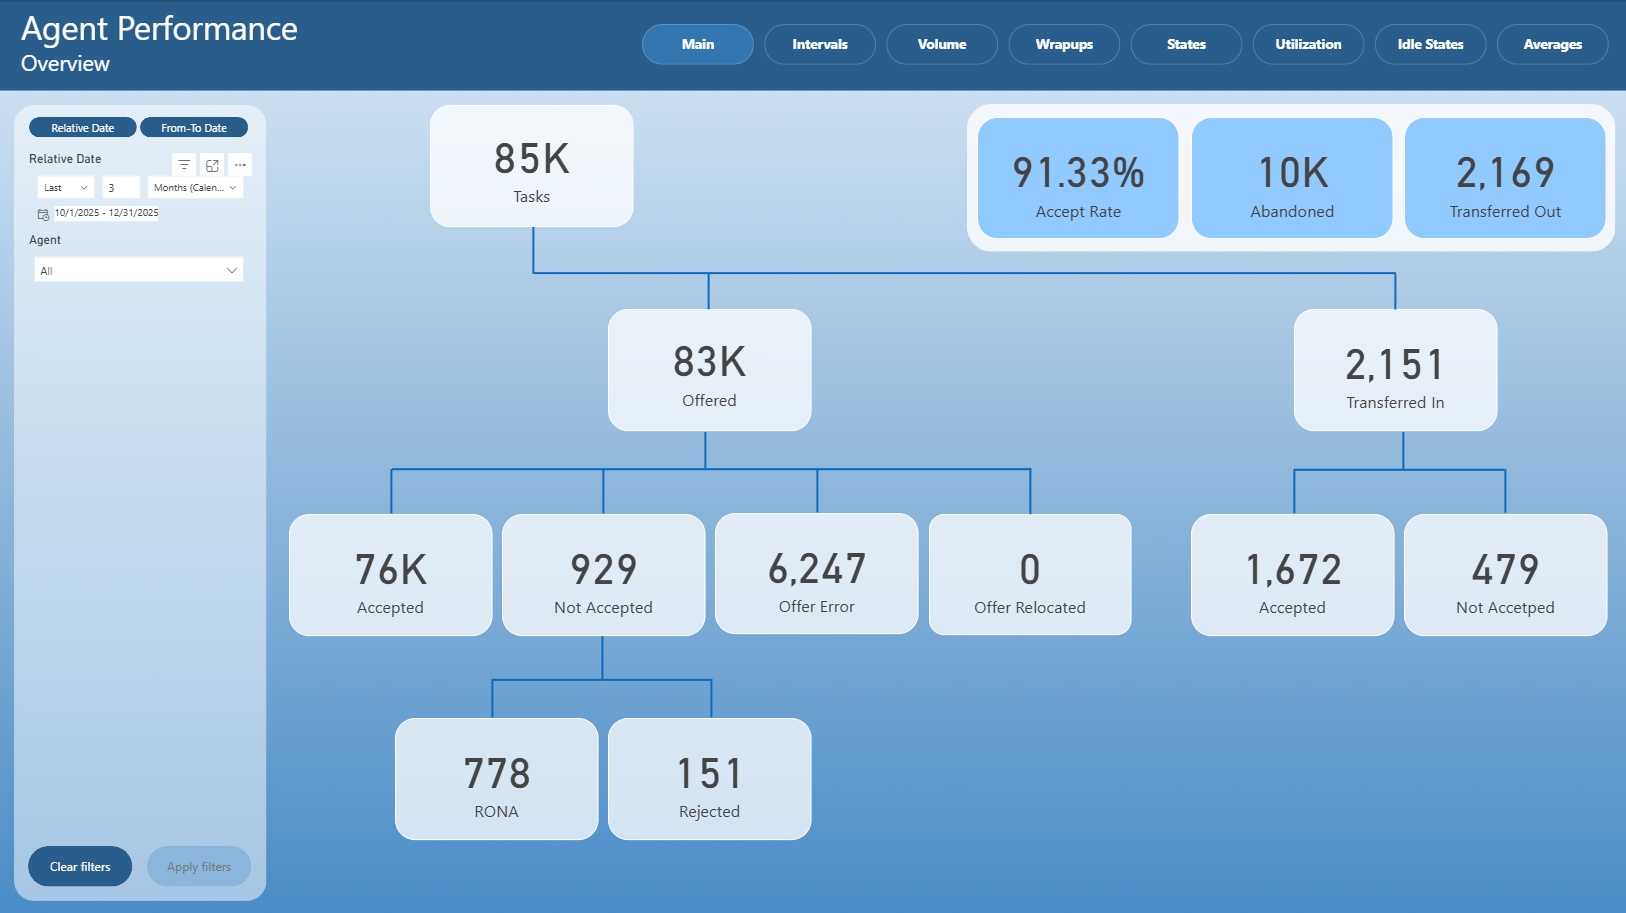
Interactive Reports
All Interactive Reports are Power BI reports and include a Filter Pane located on the left-hand side of the report.
The filter is consistent across all Interactive Reports
It defines the context for all data displayed in the report
Depending on the report, additional filters may be available, but the layout and behavior remain the same
The filter applies to the entire report, including all available pages (for example Main, Statistics, Volume, etc.)
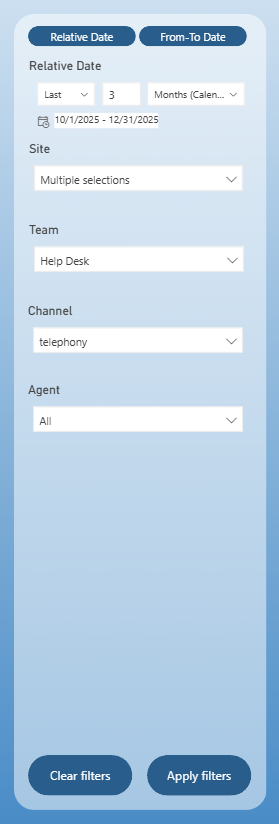
Typical filters include:
Date range (Relative Date / From–To Date)
Agent
Queue
Channel
Other report-specific filters
After modifying filter values, changes are applied only after clicking the Apply Filters button.
To reset all selected filters, use the Clear Filters button located next to Apply Filters
Until filters are applied, report visuals remain unchanged
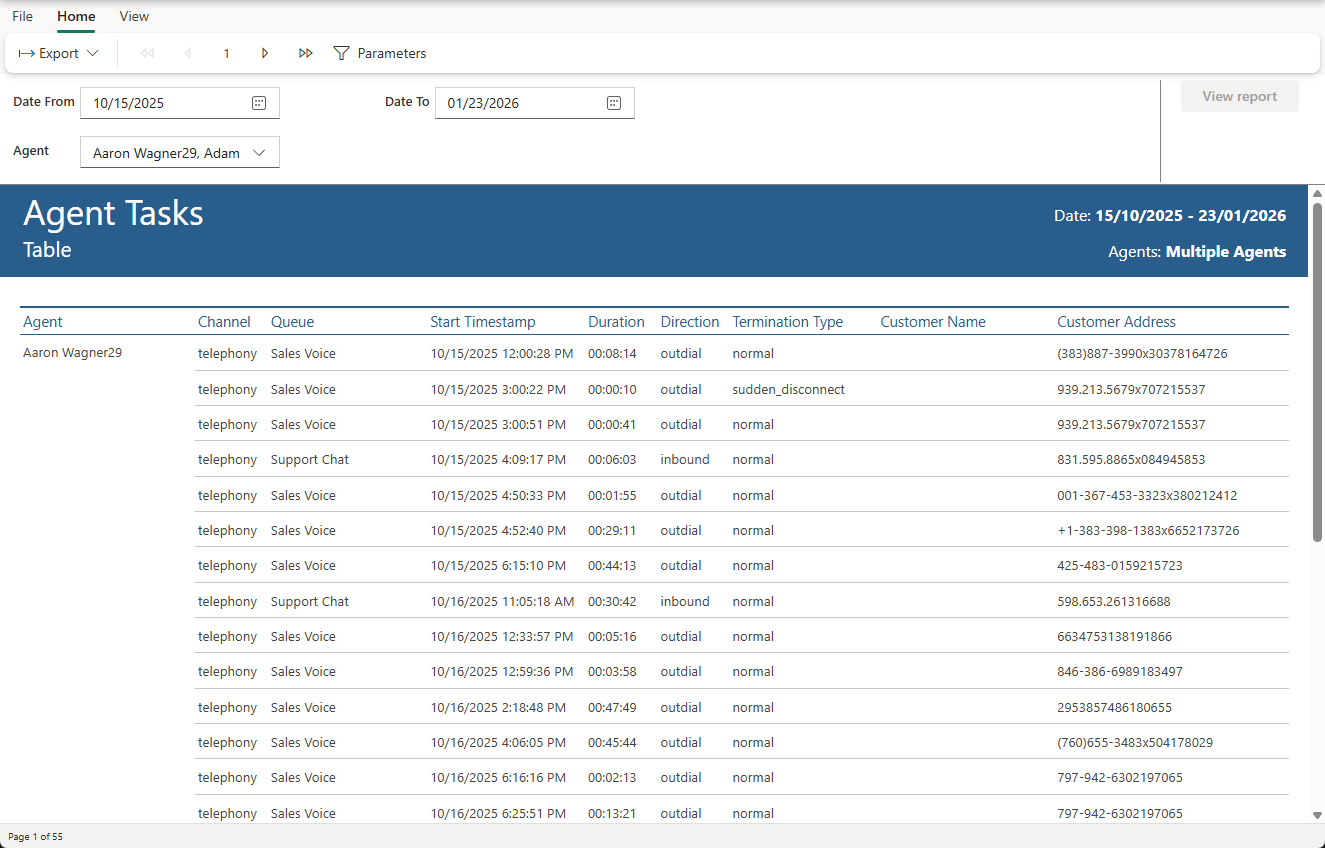
Paginated Reports
Paginated reports use a different filtering approach and do not share the common filter used in Interactive Reports.
Filters are implemented as report parameters
The layout and behavior of filters may differ between paginated reports
Filter controls are always displayed at the top of the report
Changes to parameters usually require refreshing or re-running the report

After modifying parameter values, changes are applied only after clicking the View report button.
Because paginated reports are optimized for structured output and exporting, their filtering experience is more static compared to Interactive Reports.
Paginated reports are commonly used for official reporting, audits, or sharing large datasets in a fixed format.
Exporting Reports
Historical Reports support exporting data and visuals for offline use.
Export behavior depends on the report type:
Interactive Reports export the current visual state
Paginated reports generate structured, multi-page outputs
All exports respect the currently applied filters or parameters.
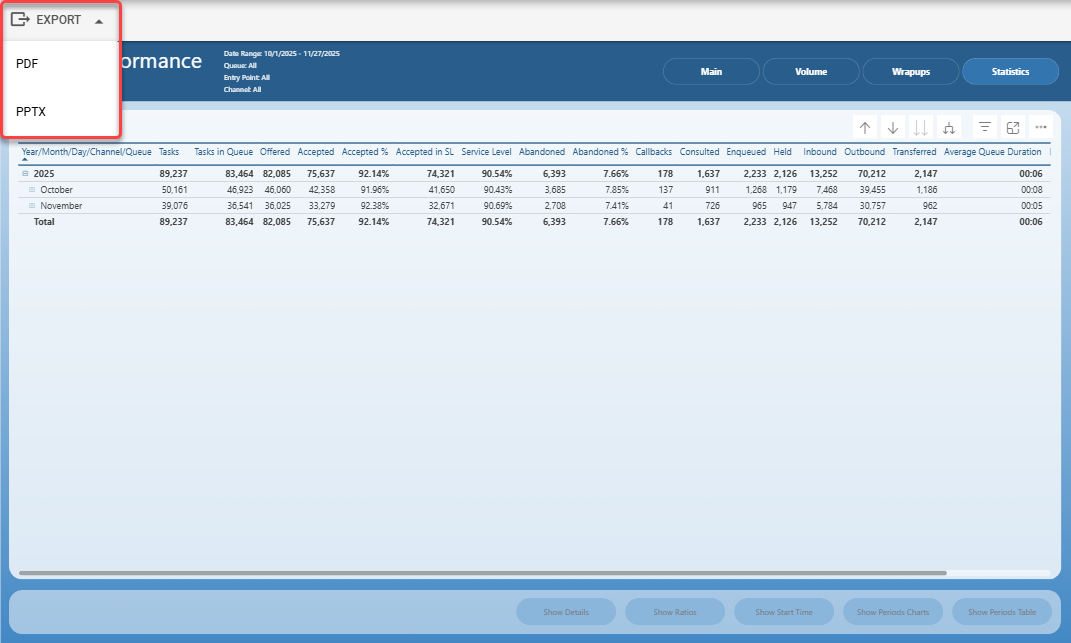
Interactive Reports
Reports can be exported using the Export option in the report toolbar
Supported export formats typically include:
PDF
PowerPoint (PPTX)
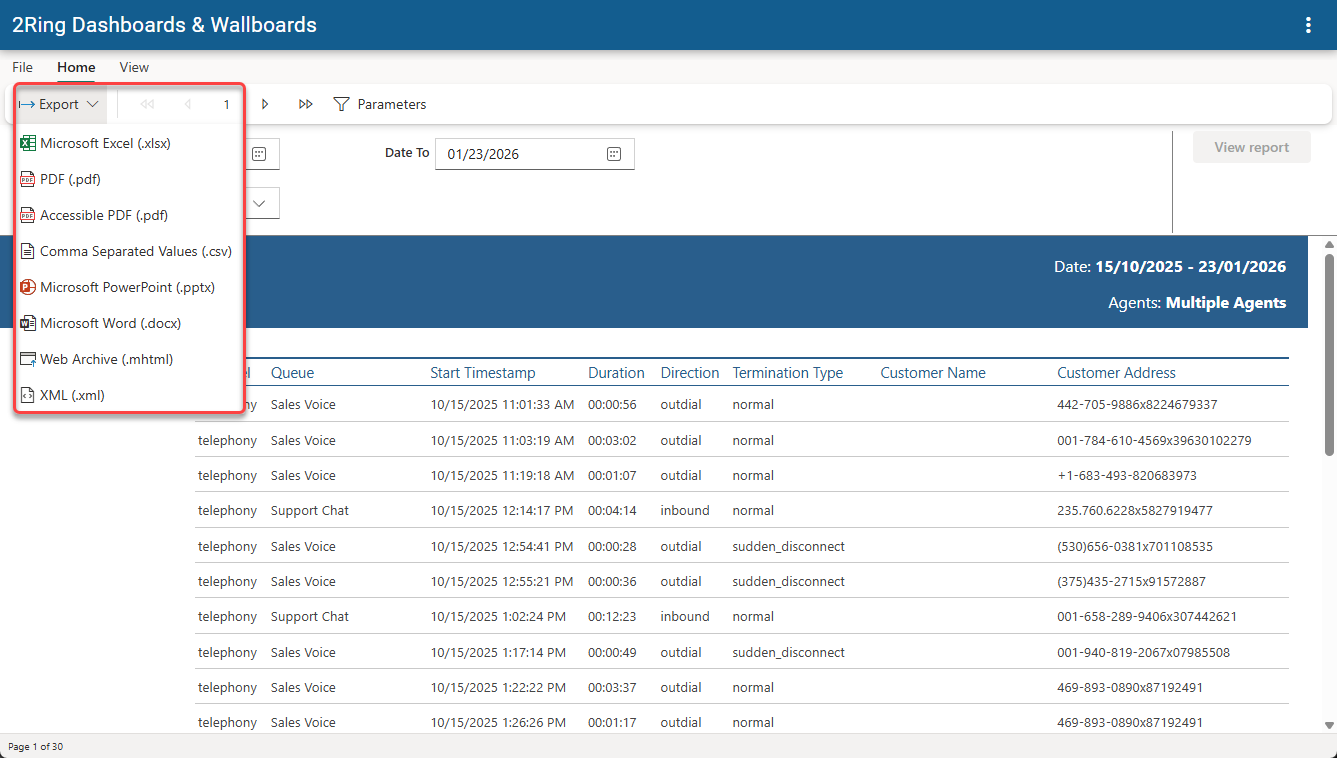
Paginated Reports
Reports can be exported using the Export option in the report toolbar
Supported export formats typically include:
Microsoft Excel (XLSX)
PDF
Comma Separated Values (CSV)
PowerPoint (PPTX)
Microsoft Word (DOCX)
Web Archive (MHTML)
XML
Drill-Through Navigation
Drill-through allows users to navigate from summarized data to more detailed views within Historical Reporting.
Two drill-through mechanisms are supported.
Drill-Through Using Buttons
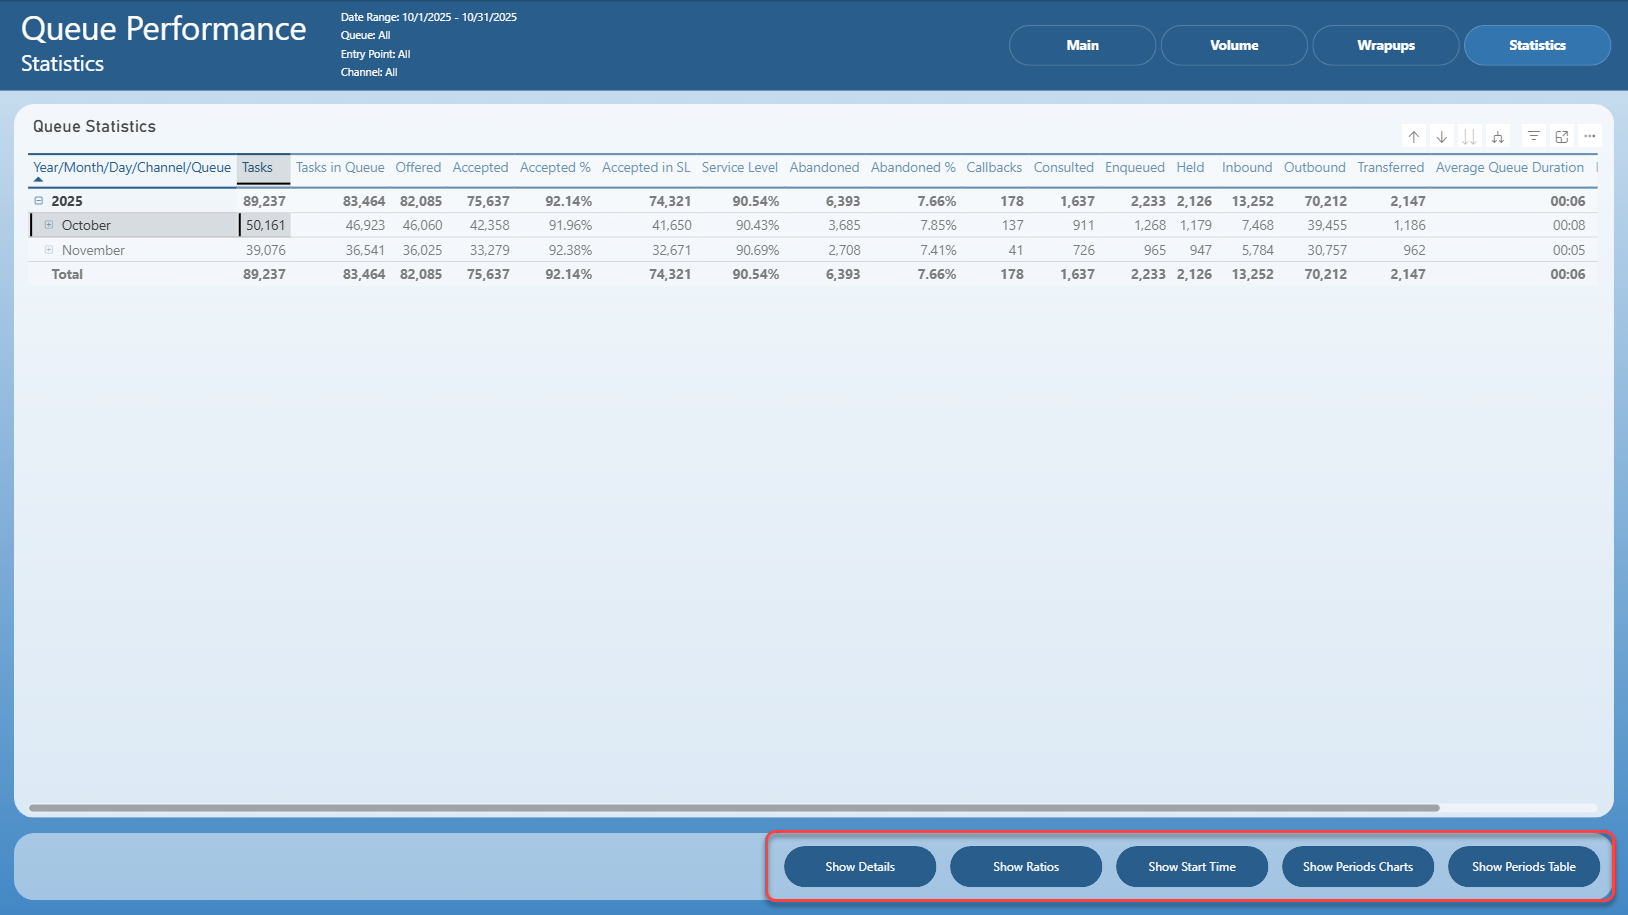
On Statistics pages of Interactive Reports, drill-through is typically performed using action buttons.
How it works:
Select a row or value in a table or matrix
Action buttons at the bottom of the page become active
Clicking a button navigates to a target page
The target page displays data related to the selected row
Each button usually represents a different type of detailed view.
This approach provides a guided and controlled navigation experience.
Native Drill-Through (Context Menu)
Drill-through can also be performed using the native Power BI functionality.
Steps:
Right-click on a data point or table row
Select Drill through from the context menu
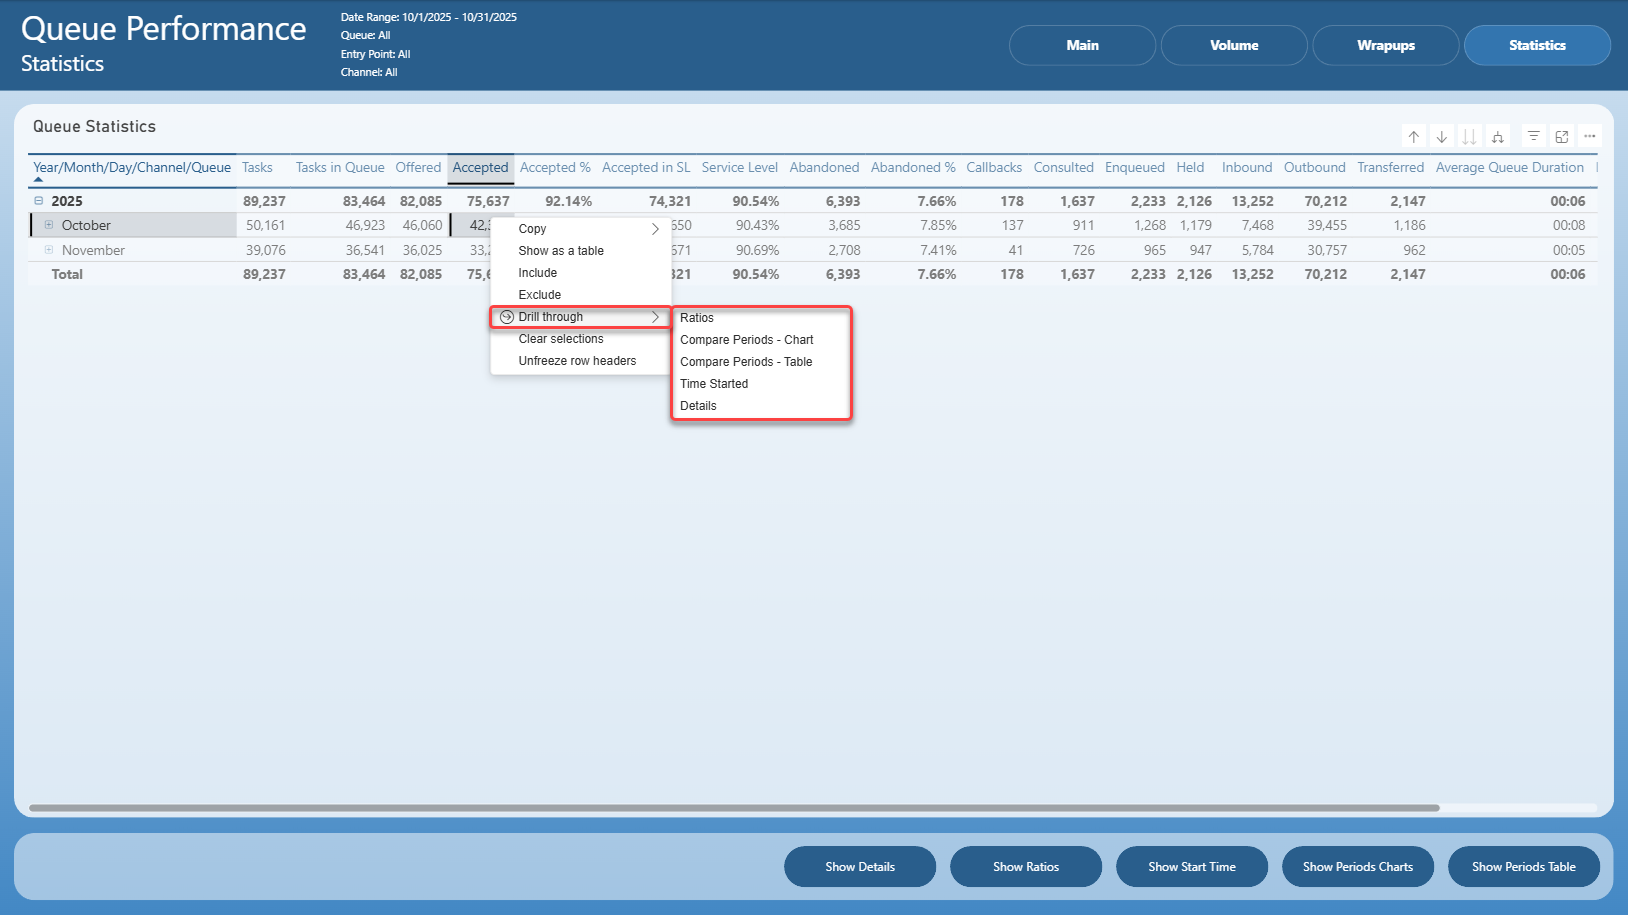
This method enables ad-hoc navigation based on predefined drill-through relationships.
Data Refresh and Retention
This section describes how historical report data is refreshed and how long it is retained in the system.
Data Refresh
Historical report data is updated on a daily basis.
Data refresh occurs once per day after midnight
Each refresh processes data from the previous day
Newly refreshed data becomes available automatically in all Historical Reports
No manual refresh action is required from the user
Data Retention
Historical data is stored for a limited retention period.
Data is retained for 36 months
After this period, historical records are automatically deleted
Retention duration applies to all Historical Reports unless explicitly agreed otherwise
Embedding Reports in Layouts
Historical Reports can be embedded directly into a layout using the Web Page segment.
This allows users to view reports in the context of a layout without navigating to the reporting section separately.
Web Page Segment
To embed a report:
Add a Web Page segment to the layout
In the segment configuration, fill in the URL field with the report URL
Report URL can be obtained by copying the browser address bar URL while viewing the desired report
No additional configuration is required
The Web Page segment loads the report directly from the provided URL.
Interactivity of Embedded Reports
Embedded reports remain fully interactive when displayed in a layout.
Users can interact with the embedded report in the same way as when viewing it directly in Historical Reporting, including:
Clicking on visuals and data points
Switching between report pages or tabs
Applying and adjusting report filters
Using drill-through actions (where supported by the report)
All interactions respect the same filtering, navigation, and permission rules as the original report.
Access and Permissions
Visibility of an embedded report depends entirely on user permissions.
An embedded report is visible only to users who have sufficient permissions to view Historical Reports
Users without the required permissions will not be able to see the embedded report
Business Unit Scope
The system does not restrict report visibility based on the Business Unit the user currently belongs to
If a user has permission to view Historical Reports, they can view:
Reports from their own Business Unit
Reports from other Business Units
Custom Reports
Historical Reporting allows users to create and work with Custom Reports based on existing reports.
Custom Reports enable users to tailor reports to their specific needs while preserving the original data model and metrics.
Supported Report Types
Custom Reports can be created only from Interactive Reports.
Interactive Reports support customization and editing
Paginated Reports cannot be used to create Custom Reports
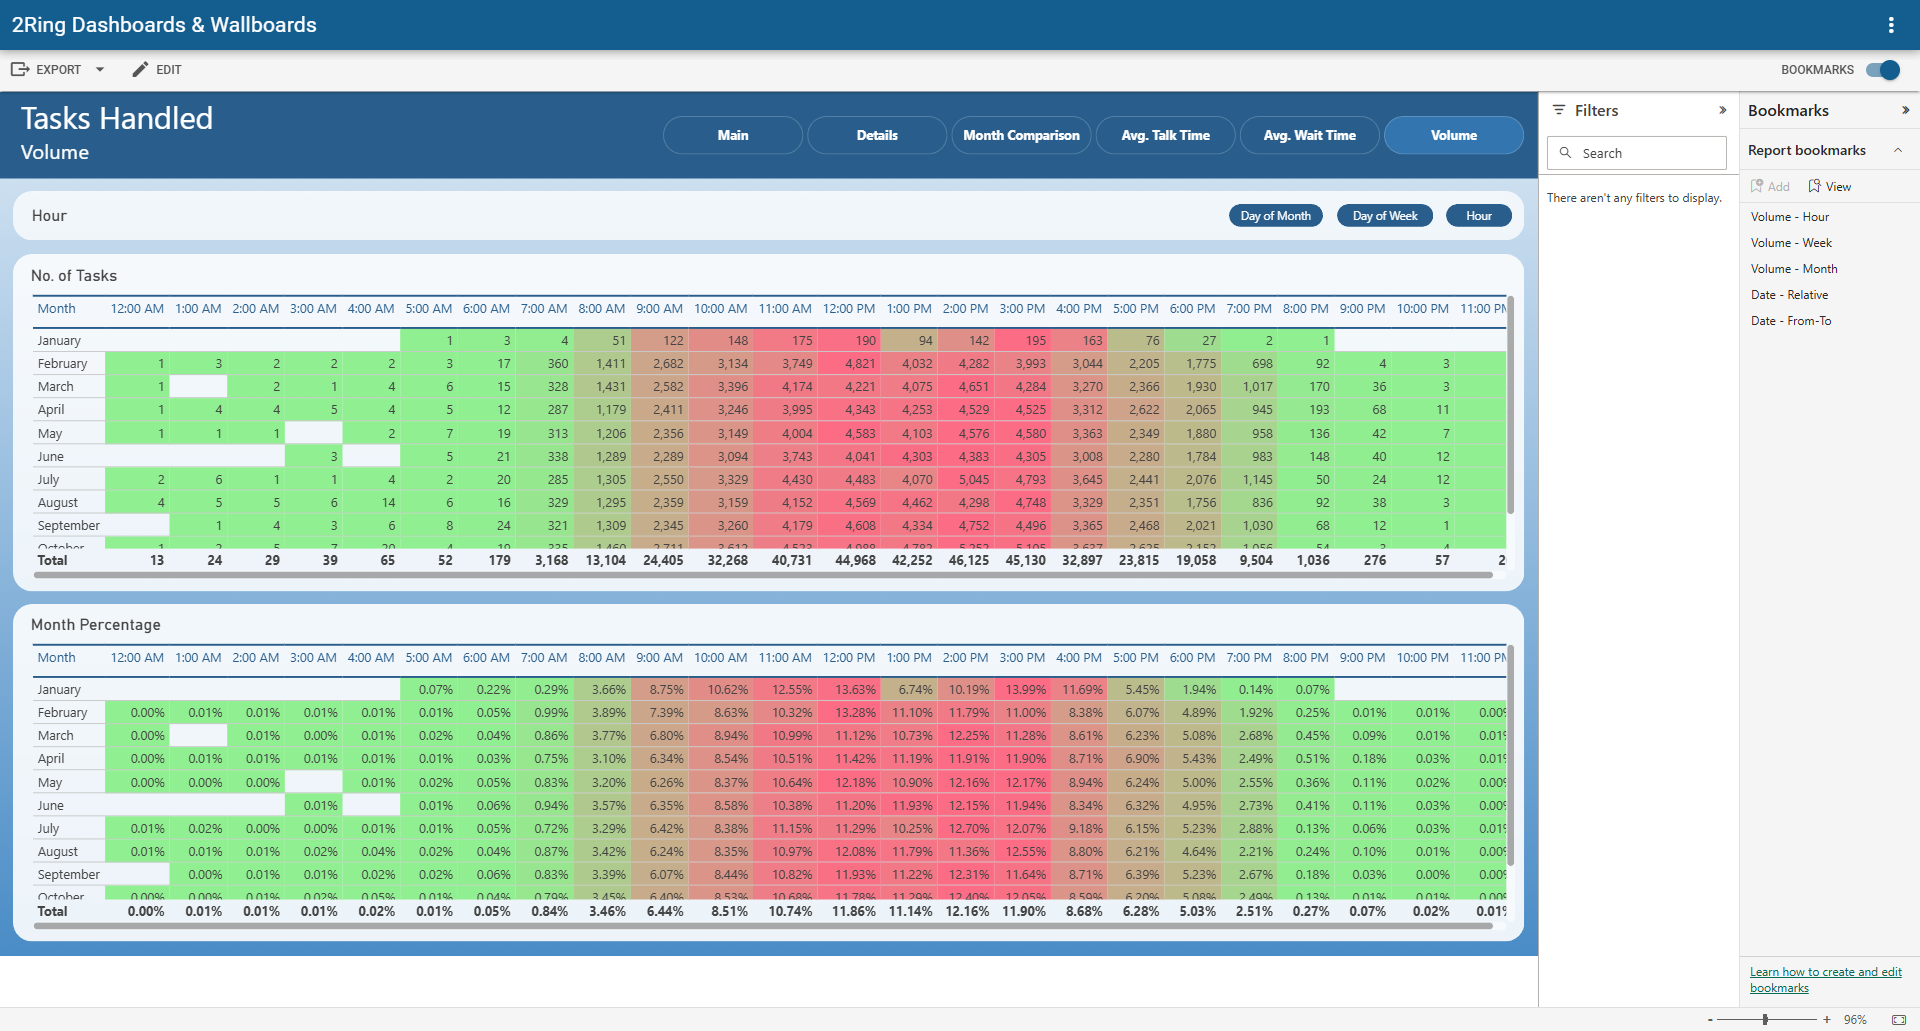
View and Edit Modes
When working with a Custom Report, users can switch between View and Edit modes.
The Edit and Reading View buttons are located to the right of the Export button in the report toolbar

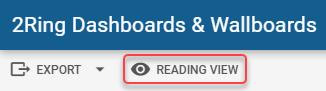
Clicking Edit switches the report to edit mode
Clicking Reading View switches the report back to view mode
Both modes are available when creating or viewing a Custom Report.
Permissions
Creating and editing Custom Reports depends on the user role assigned during user creation.
The following roles are supported:
Report Editor
Can create Custom Reports
Can switch reports to Edit mode
Can modify reports and manage bookmarks
Report Reader
Can view Custom Reports
Cannot switch to Edit mode
Cannot modify reports or manage bookmarks
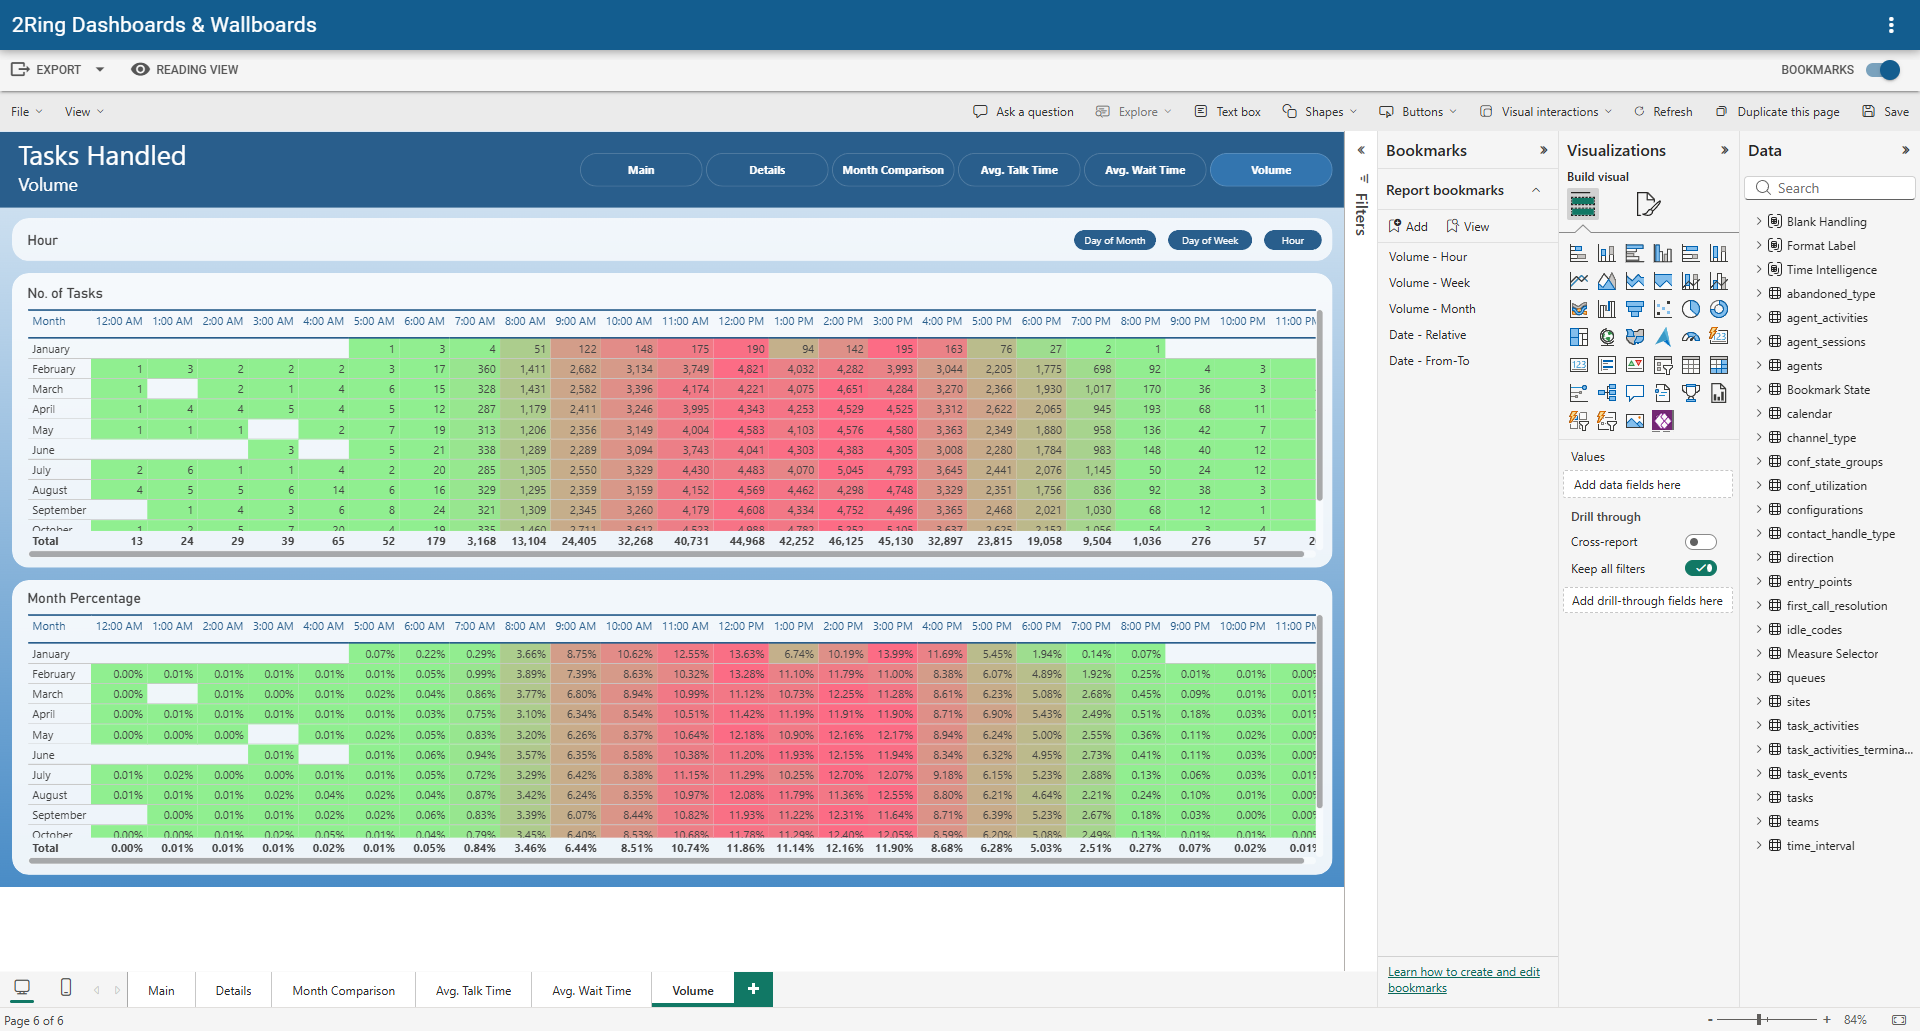
Bookmarks
Bookmarks allow users to save the current report state for later reuse.
A bookmark stores the current filter configuration so users do not need to repeatedly reapply the same filters.
Configuring Bookmarks
Bookmarks can be created and managed only in Edit mode
In Edit mode, users first configure filters as needed
The Bookmarks switch is located on the right-hand side of the toolbar.
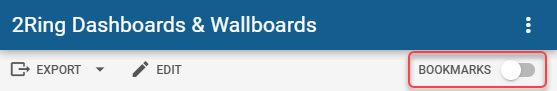
Enabling the switch opens the Bookmarks panel
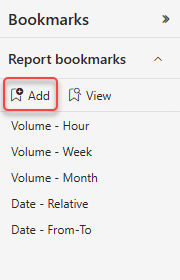
To create a new bookmark:
Switch the report to Edit mode
Configure the desired filters
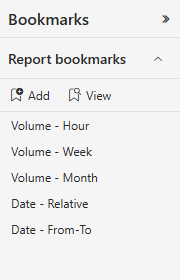
Open the Bookmarks panel
Click Add to create a new bookmark
Applying Bookmarks
All configured bookmarks are listed in the Bookmarks panel
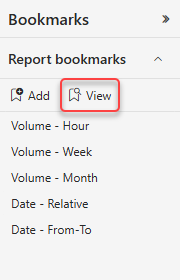
A bookmark can be applied by selecting it in the list
When View button is clicked:
A gray panel appears at the bottom of the screen
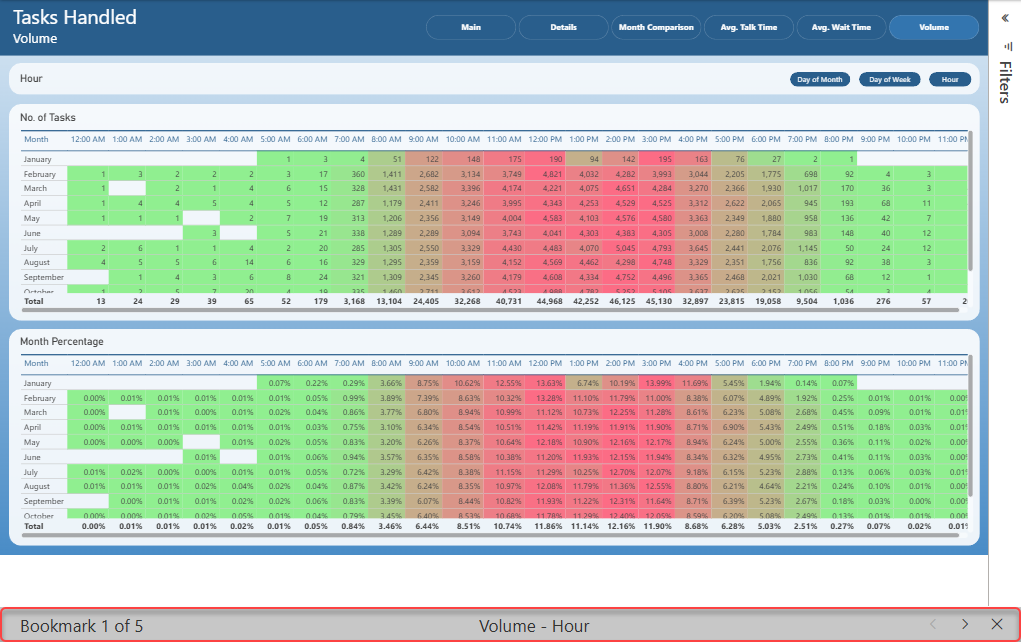
The panel displays:
Bookmark position (for example Bookmark 1 of 26)
Bookmark name
Navigation arrows to move between bookmarks
An X button to exit bookmark viewing mode
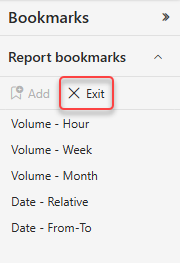
Bookmark viewing mode can be exited by:
Clicking the X button,

or
Clicking the Exit button (the View button changes to Exit while the mode is active)
Bookmarks in View Mode
Bookmarks created in Edit mode are also available in View mode
In View mode, users can apply bookmarks from the Bookmarks panel to quickly restore saved filter configurations
General Behavior Notes
All values represent historical data for the selected time range
In Interactive Reports, filters must be explicitly applied using the Apply Filters button
In paginated reports, filters are applied via report parameters
Drill-through and exports operate within the same applied filter or parameter context
Visual layout and interactions may vary between reports, but the principles described in this chapter always apply
Editing Custom Reports
Editing and creating Custom Reports follows standard Power BI / Microsoft Fabric report editing behavior.
For detailed instructions, refer to the official Microsoft documentation.: