Historical Reporting
DW synchronizes relevant data on a daily basis. These synchronized datasets can be used to generate interactive historical reports.
2Ring provides several predefined reports that cannot be edited. However, users can create new custom reports based on these predefined ones and edit them as needed.
Access and Permissions
Viewing Reports: Available to Tenant Admins, and Report Editors/Readers.
Editing Reports: Available to Tenant Admins, and Report Editors.
Enabling Historical Reporting
To enable the ability to view and edit reports, please contact 2Ring Support.
Reporting Interface and Layout
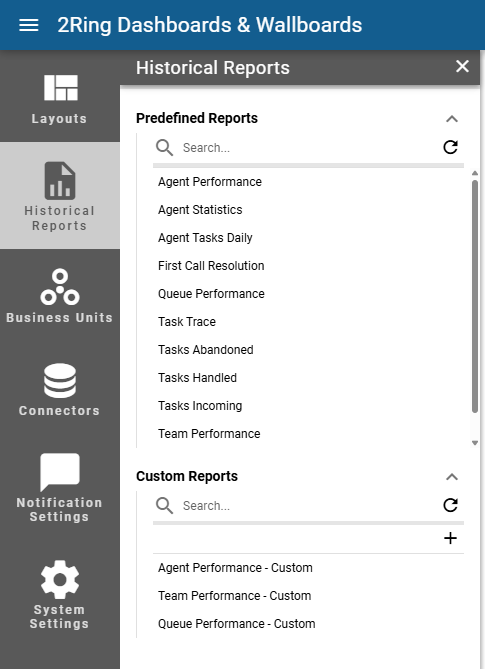
Accessing Reports in Admin Portal
Reports are accessible through the Administration Tool in the Historical Reports tab.
Predefined Reports: Contains read-only Power BI and Paginated reports provided by 2Ring
Custom Reports: User-created and editable reports based on predefined templates
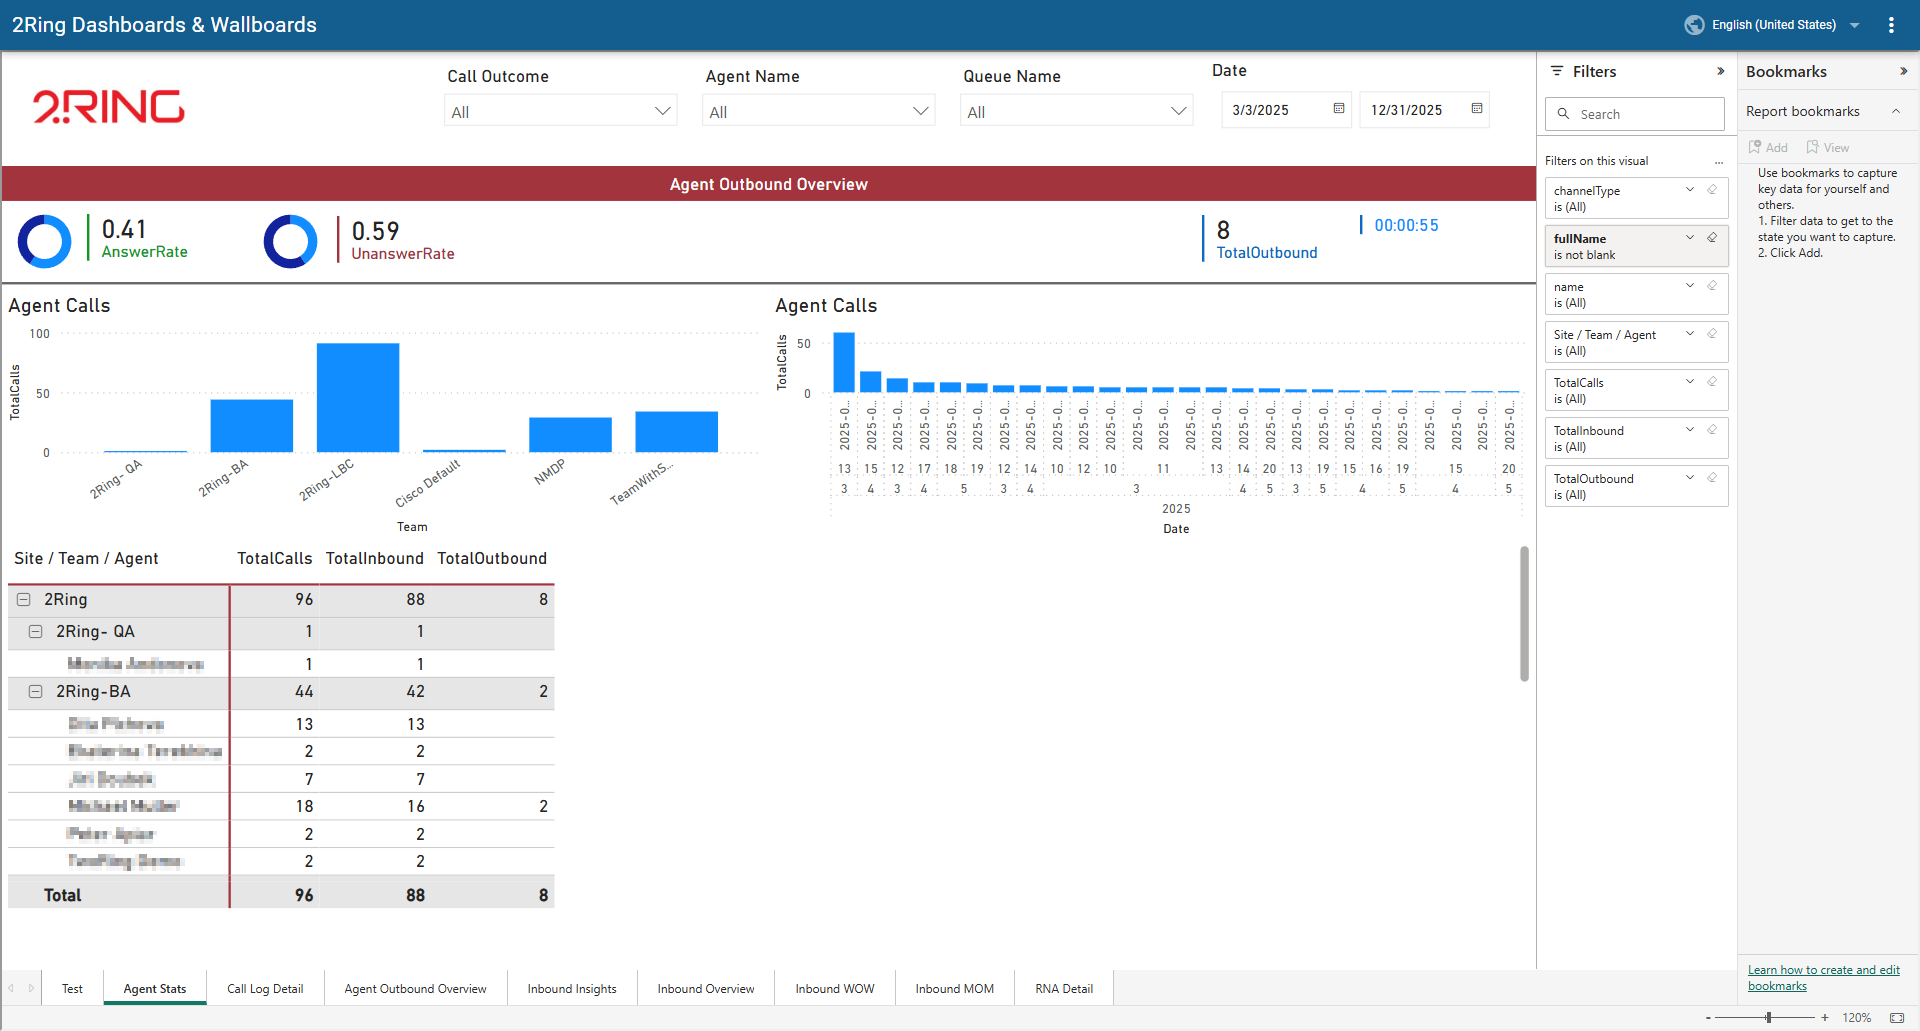
Report Interface Overview
The interface for historical reports is powered by Microsoft Power BI. Each report displays:
Report Toolbar: Contains visualization controls and export options
Time-based Filters: Ability to select date ranges and drill down into historical data
Interactive Visualizations: Charts, tables, and metrics powered by Power BI
For more information on working with Power BI reports, refer to the Microsoft Power BI Documentation.
Example of a historical report:
Managing Reports
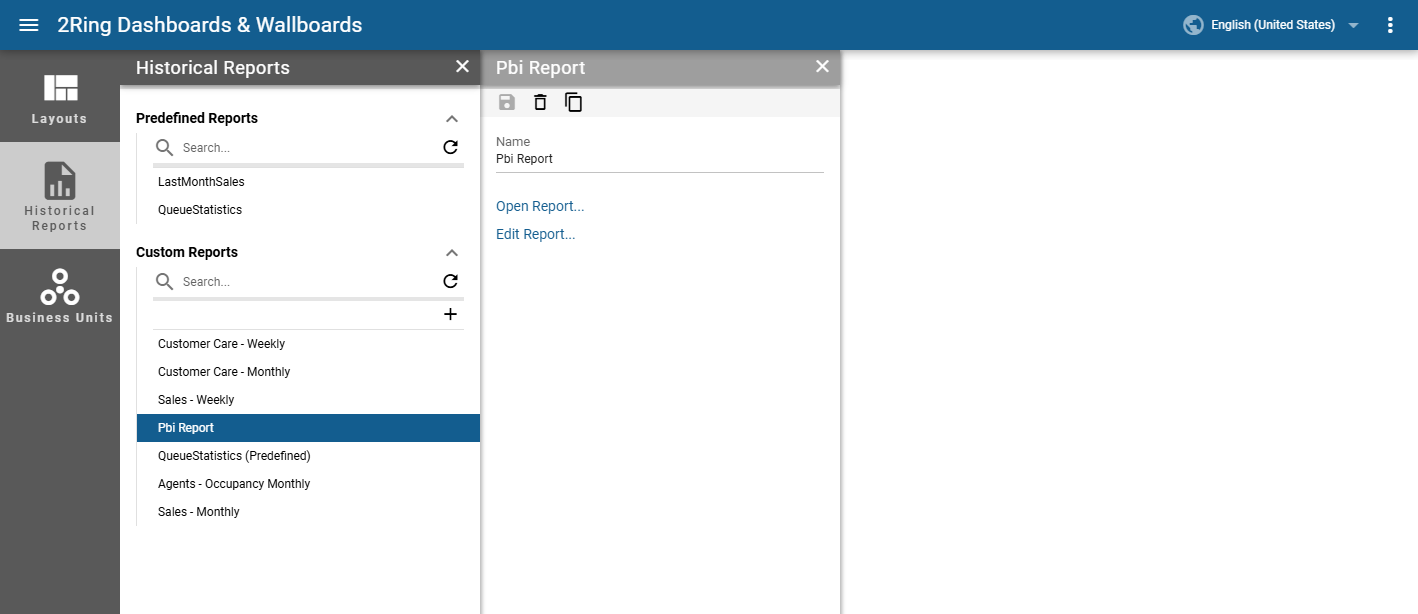
Opening and Viewing Reports
To open and view a historical report:
Navigate to Administration Tool → Historical Reports
Select a report from the Predefined Reports or Custom Reports list
Click on the Open Report… button
Use the toolbar to interact with visualizations, apply filters, and export data
Creating Custom Reports from Templates
To create a new custom report:
Navigate to Administration Tool → Historical Reports
Click Create New Report in the Custom Reports section
Enter a name of a report and select a predefined report template to base your custom report on
The report will be created
Duplicating Reports
To clone an existing report:
Select the report you wish to clone from the Predefined Reports or the Custom Reports section
Click the Duplicate option in the toolbar
Provide a new name for the duplicated report
The new report will be created with the same configuration and visualizations in the Custom Reports section
You can now customize the duplicated report as needed
Customizing Reports
To customize and edit a custom report:
Select the custom report from the Custom Reports section
Click Edit Report… to enter editing mode
For information about editing Power BI reports, refer to the Microsoft Power BI Documentation
Click Save to save your changes
Linking Historical Reports from Layouts
Historical reports can be linked directly from Layout, allowing users to access relevant historical data without navigating through the admin portal menu.
Creating Report Links in Layouts
To link a historical report from a layout:
Open the layout
Select a desired segment that will refer the report
Open the Title and Paging info group
Enable the Enable Hyperlink option
Disable the Target Layout option
Fill the URI field with the report link containing filter parameters in JSON format.
Save the layout configuration
URI Format
https://{baseUrl}/admin/report.html
  ?reportId={reportId}
  &filters=[{
      "logicalOperator":"{logicalOperator}",
      "conditions":[
        {
          "value":"{conditionValue}",
          "operator":"{conditionOperator}"
        }
      ],
      "target":{
        "table":"{targetTable}",
        "column":"{targetColumn}"
      },
      "filterType":{filterType1}
    },{
      "target":{
        "table":"{targetTable2}",
        "column":"{targetColumn2}"
      },
      "operator":"{operator2}",
      "values":["{valueListItem1}", "..."],
      "filterType":{filterType2}
    }]
Placeholder |
Description |
|---|---|
|
Base URL for the tenant instance |
|
Identifier of the historical report to be displayed |
|
Logical operator used to combine conditions (e.g. |
|
Value used in the filter condition |
|
Operator applied in the condition (e.g. |
|
Name of the table targeted by the first filter |
|
Name of the column targeted by the first filter |
|
Numeric filter type for the first filter definition |
|
Name of the table targeted by the second filter |
|
Name of the column targeted by the second filter |
|
Operator used by the second filter (e.g. |
|
Value item used in a multi-value filter (e.g. |
|
Numeric filter type for the second filter definition |
Example URI format for linking to a historical report:
The following example demonstrates a real-world URI that links to a historical report and pre-filters the data to a specific agent.
This scenario is commonly used when linking a report from a grid or layout segment that represents an individual agent.
https://example.dwcloud.com/admin/report.html
  ?reportId=3f8c1b42-9a21-4e3a-9c4e-7b12f4d9aabc
  &filters=[{
     "logicalOperator":"And",
     "conditions":[
       {
         "value":"John Doe",
         "operator":"Equals"
       }
     ],
     "target":{
       "table":"Agents",
       "column":"AgentName"
     },
     "filterType":1
    }]
Example URI format with placeholder
The following example shows how a report link defined on a grid segment automatically filters the report based on the clicked row value.
In this example, each grid row represents a single agent, and the report is filtered by the agent name from the grid column.
https://example.dwcloud.com/admin/report.html
  ?reportId=3f8c1b42-9a21-4e3a-9c4e-7b12f4d9aabc
  &filters=[{
     "logicalOperator":"And",
     "conditions":[
       {
         "value":"{{value}}",
         "operator":"Equals"
       }
     ],
     "target":{
       "table":"Agents",
       "column":"AgentName"
     },
     "filterType":1
    }]
Placeholder usage in grid segments
When a historical report is linked from a grid segment, the placeholder {{value}} represents the value of the grid column where the hyperlink is defined for the clicked row.
This allows each row in the grid to link to the same report, automatically filtered based on the row it was clicked from.
Accessing Linked Reports
Users viewing a layout with linked historical reports can:
Locate the report link in the layout view
Click the report link to open the historical report
The report may open with pre-filtered data based on the URI used
Interact with and export data from the report as usual
Embedding Reports in Layouts
Historical Reports can be embedded directly into a layout using the Web Page segment.
This allows users to view reports in the context of a layout without navigating to the reporting section separately.
Web Page Segment
To embed a report:
Add a Web Page segment to the layout
In the segment configuration, fill in the URL field with the report URL
Report URL can be obtained by copying the browser address bar URL while viewing the desired report
No additional configuration is required
The Web Page segment loads the report directly from the provided URL.
Interactivity of Embedded Reports
Embedded reports remain fully interactive when displayed in a layout.
Users can interact with the embedded report in the same way as when viewing it directly in Historical Reporting, including:
Clicking on visuals and data points
Switching between report pages or tabs
Applying and adjusting report filters
Using drill-through actions (where supported by the report)
All interactions respect the same filtering, navigation, and permission rules as the original report.
Access and Permissions
Visibility of an embedded report depends entirely on user permissions.
An embedded report is visible only to users who have sufficient permissions to view Historical Reports
Users without the required permissions will not be able to see the embedded report
Business Unit Scope
The system does not restrict report visibility based on the Business Unit the user currently belongs to