
What’s New in Release 2606
Welcome to the 2606 release of 2Ring Dashboards & Wallboards. This document provides an overview of all new features and improvements included in this update, along with guidance on how to locate, enable, and use each one.
Read on to discover what’s new.
All features in the 2606 release are also available on our public demo platform. To explore them, request instant access through our free trial form.
In This Release
Enhanced Gamification with Dynamic Segments
Pie Charts with a Dynamic Number of Segments
New Paging Options for Grids, Sequences and PDF Files
Color Palettes in Themes
Editor Interactive Preview Mode
Quick Peek
Introducing AI Assistant Data
AI Assistant on Mobile
License Handling
Connector Updates
Forward Audit Logs to Your SIEM or Log Aggregator
1. Enhanced Gamification with Dynamic Segments
Earlier versions of Dashboards & Wallboards offered a limited set of gamification tools for building lively layouts with moving parts that bring out the competitive spirit in your contact center. The catch was upkeep. Keeping those layouts in sync took real effort.
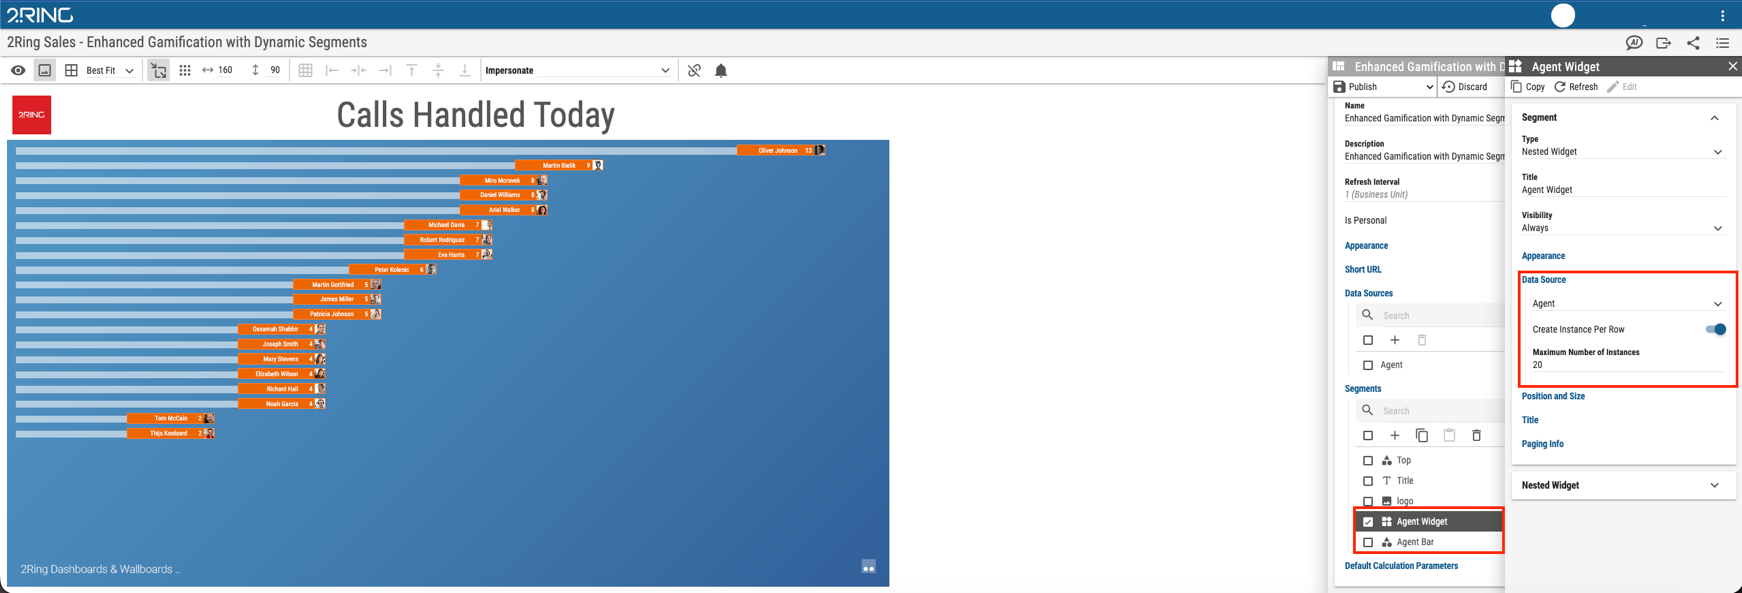
The new Dynamic Segments feature removes that burden. Once you configure a dataset to drive the game, you pick a single segment and let it replicate automatically for every row in that dataset. For example, the data source can be a list of agents ranked by calls handled, and the segment a single agent tile showing the name and the score. That one tile then repeats automatically for every agent in the list. There is no longer a need to keep multiple copies in sync. Setup and ongoing maintenance become far simpler, so you can focus on the fun part, defining the visuals and the goals.
You can cap the number of segment instances, for example the top 5 or top 10 performers, or leave it unlimited. A single segment definition replaces the dozens of individual widget copies you previously had to create and keep in sync. The same idea works for teams ranked by calls handled, queues by service level, or agents by the highest satisfaction score.
How to enable it
Open the layout in the Layout Editor and select the segment you want to turn into a game tile.
Link the segment to the data source that will supply the game data.
In the Data Source group of the segment settings, turn on Create an Instance Per Row.
Set the Maximum Number of Instances, or leave it unlimited.
Publish the layout. The segment now repeats automatically for each row in the dataset.
Figure 1: Dynamic Segments option in the segment settings panel
For more information, see Editing Segments chapter.
2. Pie Charts with a Dynamic Number of Segments
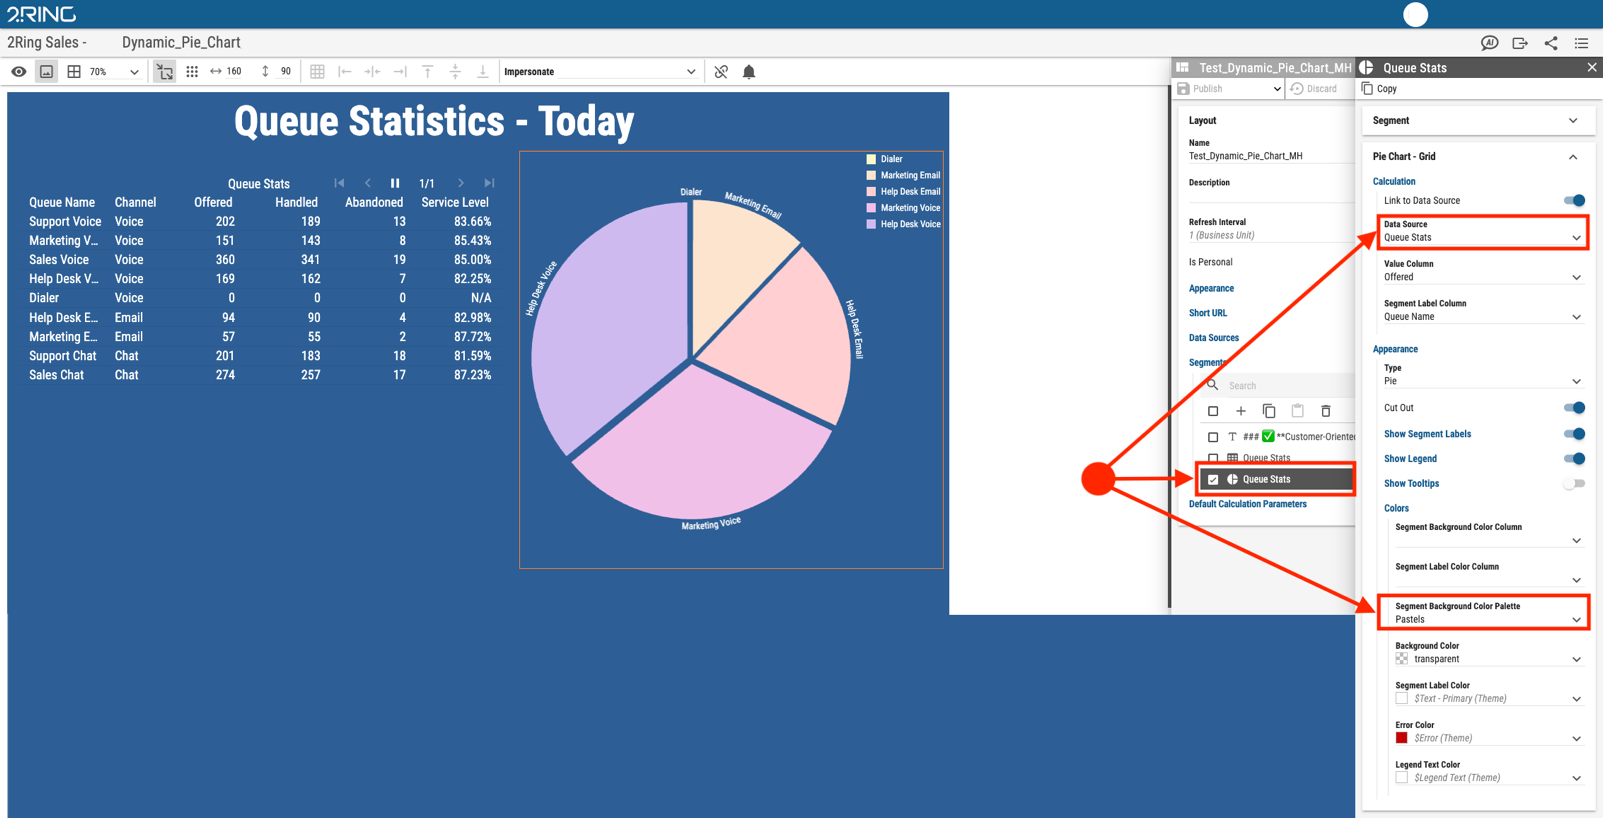
You can now configure a Pie Chart to display a flexible number of data segments based on the incoming dataset. Just pick a data source and a color palette, and let Dashboards & Wallboards do the rest.
This means you can represent datasets with a changing number of rows without any manual reconfiguration. Each row in the data source becomes its own segment, for example the top 10 or top 15 agents by calls handled, and changing that limit updates every segment instantly. When a new queue is created or a new team is built, the pie chart picks up those data points on its own and folds them into its segments.
How to set it up
Add a Pie Chart - Grid segment to your layout, or open the settings of an existing one.
Select the data source that feeds the chart.
Choose the value each segment represents and the field that supplies the label, for example calls handled as the value and the agent name as the label.
Choose a color palette for the segments.
Publish the layout. New rows in the data source now appear as new pie segments automatically.
Figure 2: Pie Chart configuration with data source and color palette selected
For more information, see Pie Chart - Grid Segment chapter.
3. New Paging Options for Grids, Sequences and PDF Files
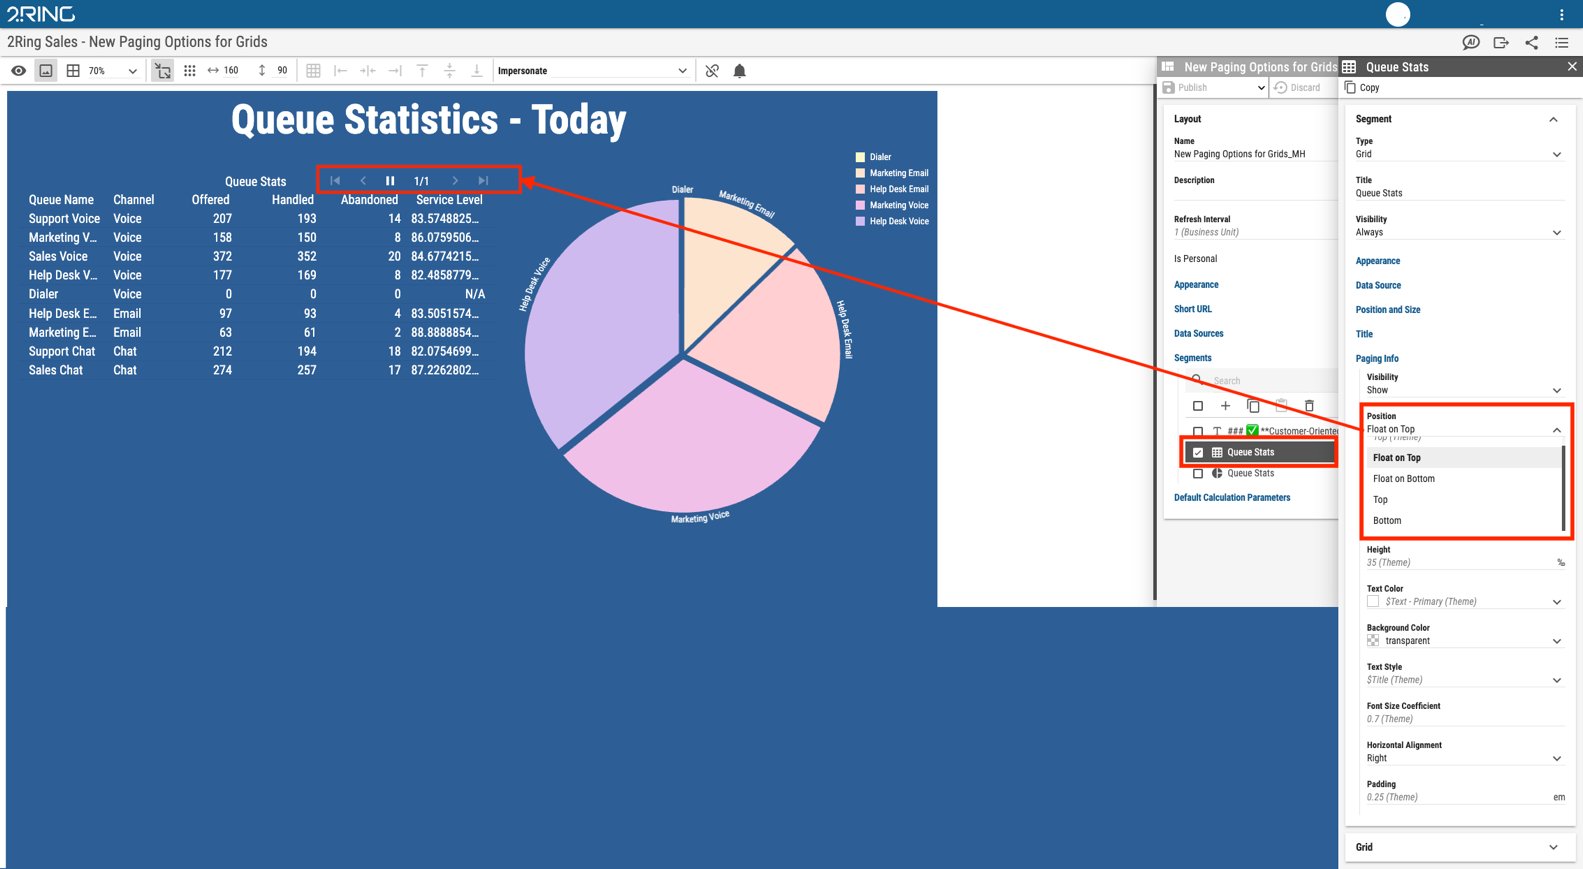
Grids, Sequences and PDF segments can now place their paging controls at the top or at the bottom, using settings that are separate from the Title settings. The paging information can also float over the title row with a transparent background, so the controls take up no extra space in the segment. This puts the manual paging controls exactly where you need them.
Where to find it
Open the settings of a Grid, Sequence or PDF segment.
Go to the Paging Info controls section.
Choose whether the controls appear at the top, at the bottom, or floating over the title row.
Publish the layout.
Figure 3: Paging control position settings inside a segment
4. Color Palettes in Themes
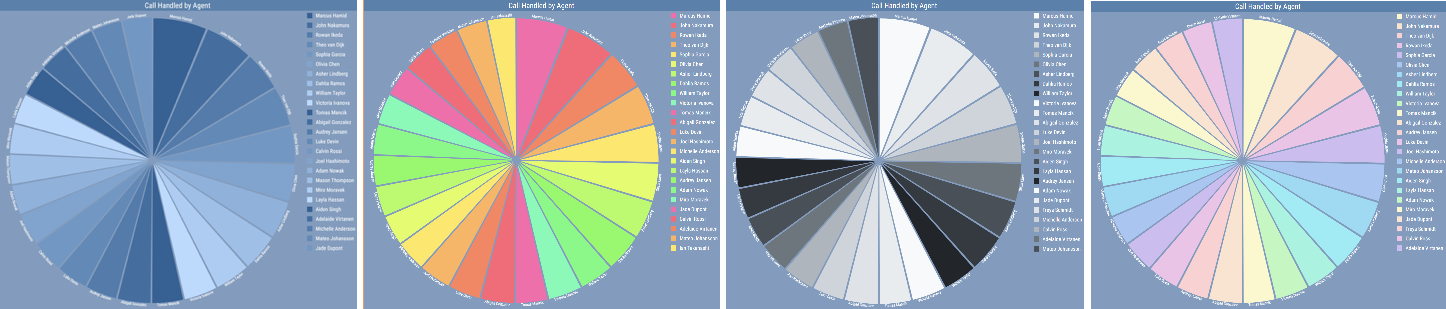
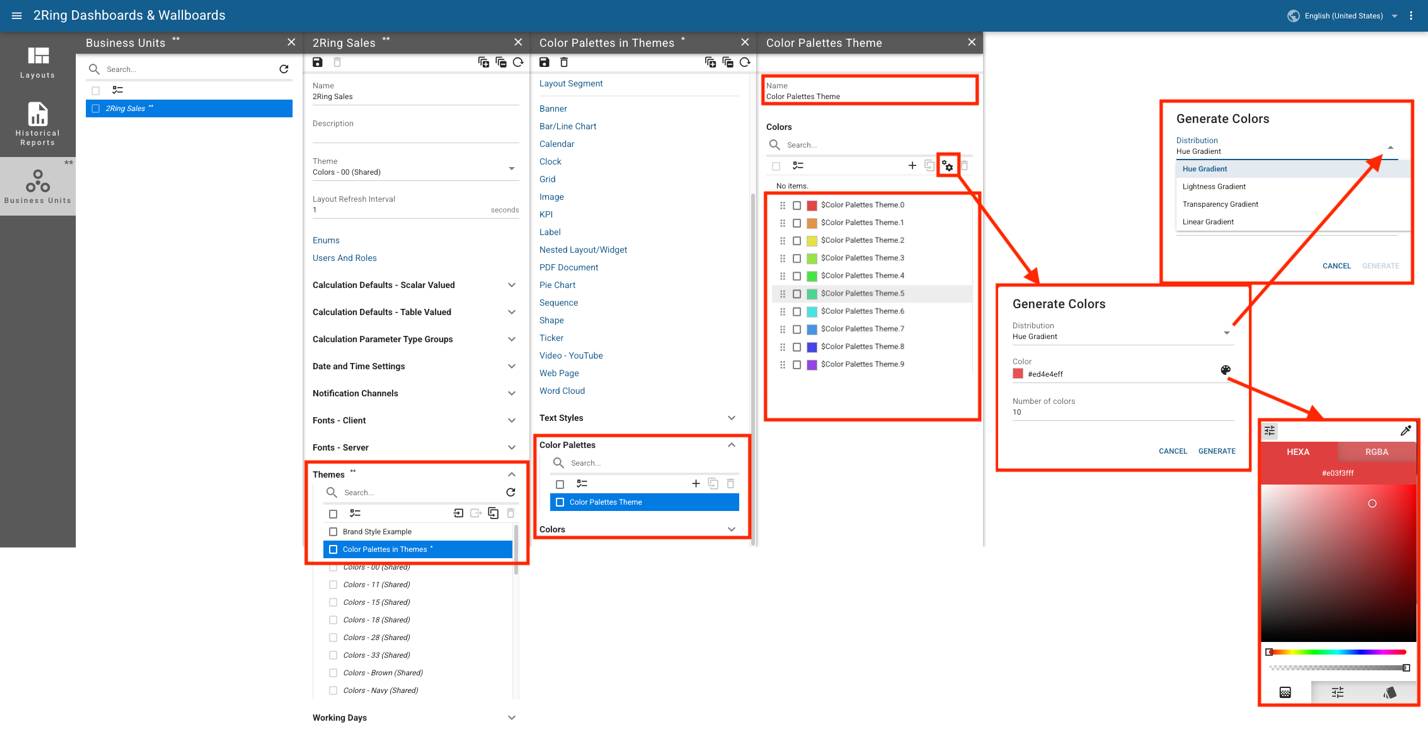
Themes can now define color palettes. Unlike standard predefined colors that you reference one at a time, a palette is a named collection of colors created in advance by the theme author. You assign a palette to segments that have a changing number of representations, and each one automatically picks a color from the palette.
You can start without creating anything. Every theme ships with ready made palettes: a gradient palette built from the colors of the theme itself, plus general collections such as pastels. Assign one of those, or build your own.
You do not have to pick every color by hand. The palette generator can build a palette for you using a hue gradient, a lightness gradient, a transparency gradient, or a linear gradient between two colors.
Figure 4: Color palette being defined inside the theme editor
Colors can also come directly from your data, for example from a column in a CSV file or from a custom calculated column. This lets the data itself decide the color of each segment.
How to use it
Go into the Administration Tool and open the Business Unit in which you want to create a palette. Open the Theme settings and create or edit a theme.
Go to the section Color Palettes and add a named color palette and click on the gear icon.
This will open the Generate Colors generator, choose how the colors should be distributed, select a starting color and the number of colors and click Generate.
Save the theme.
In a segment with a dynamic number of representations, assign the palette. Colors are then applied automatically.
Figure 5: Color palette being defined inside the theme editor
For more information, see Color Palettes chapter.
5. Editor Interactive Preview Mode
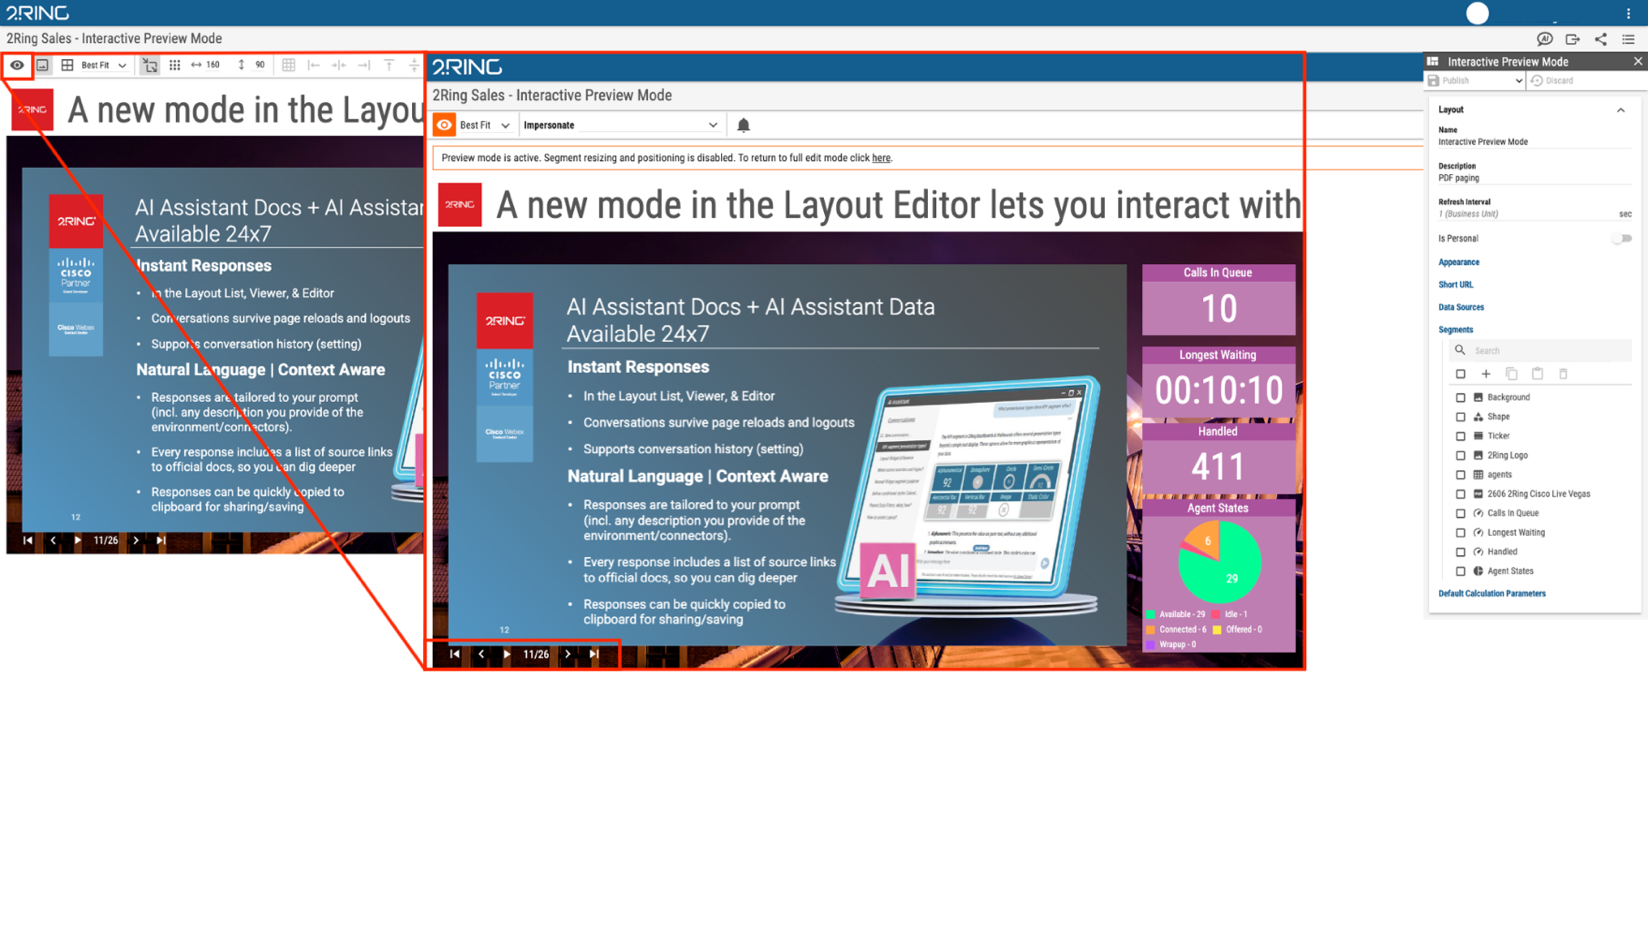
A new mode in the Layout Editor lets you interact with the layout you are editing as if it were already published. The editor controls step out of the way so you can work directly with the layout preview. You can test hyperlinks, paging controls, sorting and filtering before you publish. The preview also respects segment visibility, so segments you have hidden disappear exactly as they will for your viewers.
How to use it
Open a layout in the Layout Editor.
Switch on Interactive Preview Mode from the editor toolbar.
Click through hyperlinks, paging, sorting and filtering to test the layout.
Switch the mode off to return to editing.
Figure 6: Interactive Preview Mode toggle in the Layout Editor toolbar
For more information, see Preview Mode chapter.
6. Quick Peek
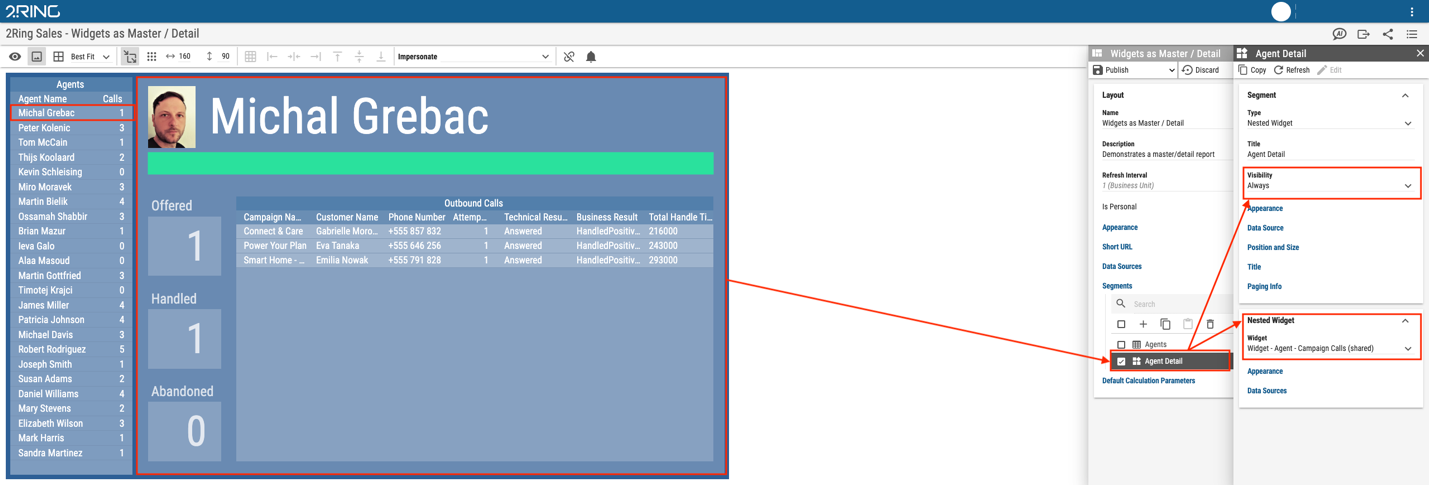
Hovering over a grid row can now reveal a Quick Peek with richer detail about that row, such as an agent or a queue. Think of it as a smarter, richer tooltip. Instead of showing only static information, it can display a whole widget instance tied to the specific row. The instance follows your mouse and switches context as you move across rows. If you prefer not to have it float, you can show the Quick Peek in a fixed location instead. Either way, you can build a true master detail view.
How to enable it
Open the settings of the widget you want to show and set its visibility to on demand.
Open the settings of the grid segment.
Choose the widget instance to display when a row is hovered. The widget receives the ID of the hovered row, so its content updates as you move from row to row.
Choose whether the Quick Peek floats with the mouse or appears in a fixed location, then save.
Figure 7: Quick Peek shown as tooltips on hover over a grid row
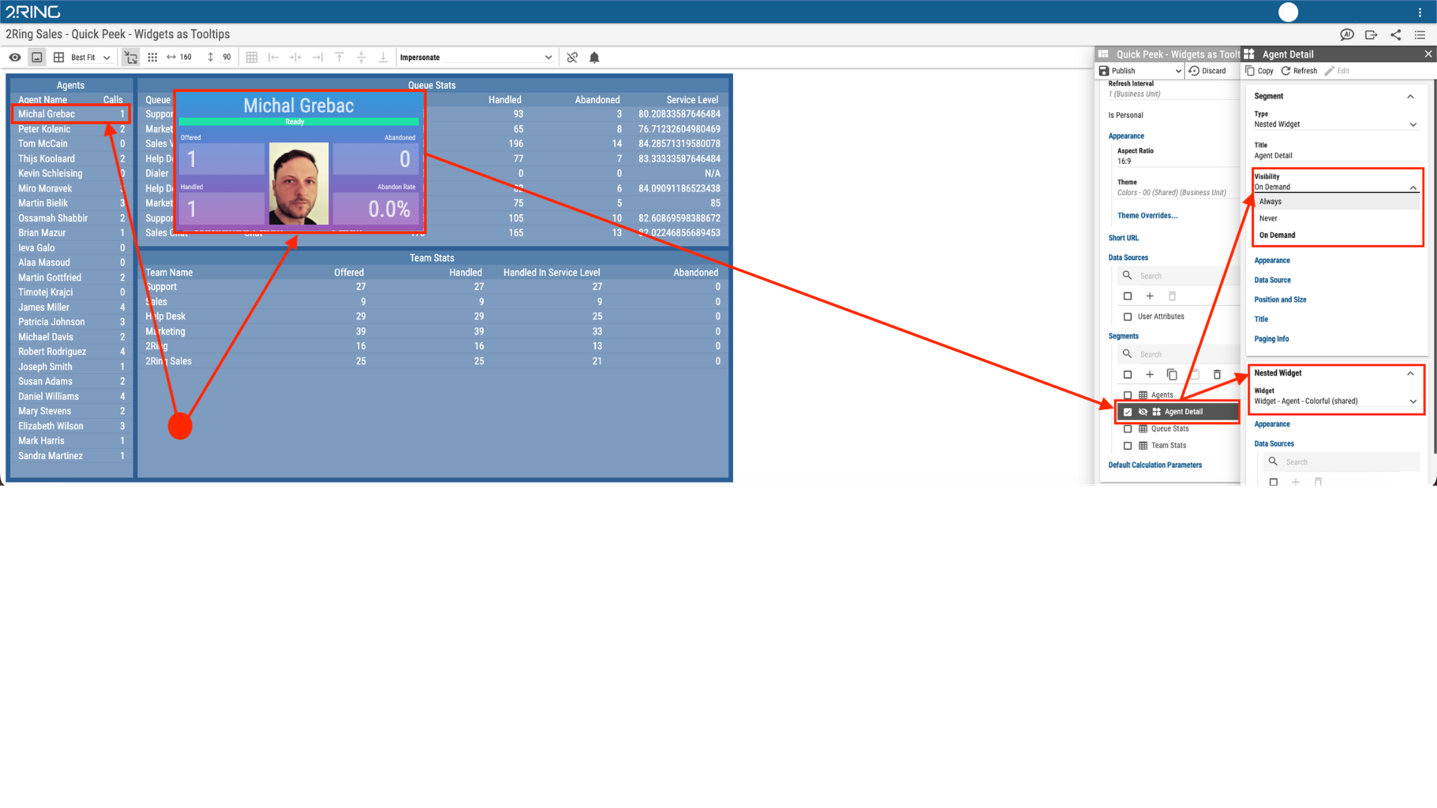
Figure 8: Quick Peek shown as fixed details on hover over a grid row
For more information, see Grid Segment chapter.
7. Quick Business Unit Switching
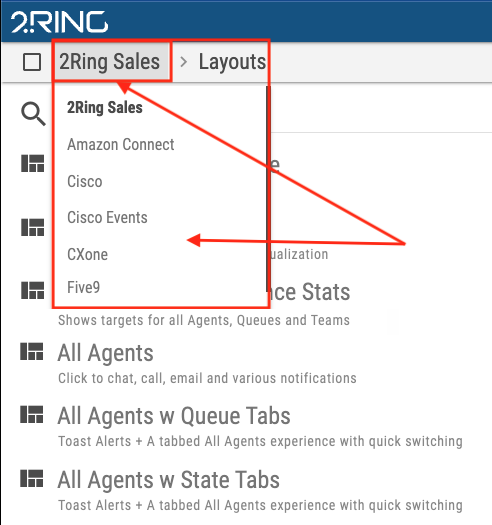
Switching between Business Units is now much faster. The name of the current Business Unit shown at the top of the screen is now clickable. Click it to open the list of Business Units available to you and jump straight to the one you need, without stepping back through earlier menus.
Because switching is now a single click, moving between Business Units is quick and effortless, which is especially useful when you monitor or manage several of them during the day.
How to use it
Find the name of the current Business Unit at the top of the screen.
Click the Business Unit name to open the list of Business Units available to you.
Select the Business Unit you want. The view switches to it immediately.
Figure 9: Quick Business Unit Switching from the top of the screen
8. Quick Layout Switching
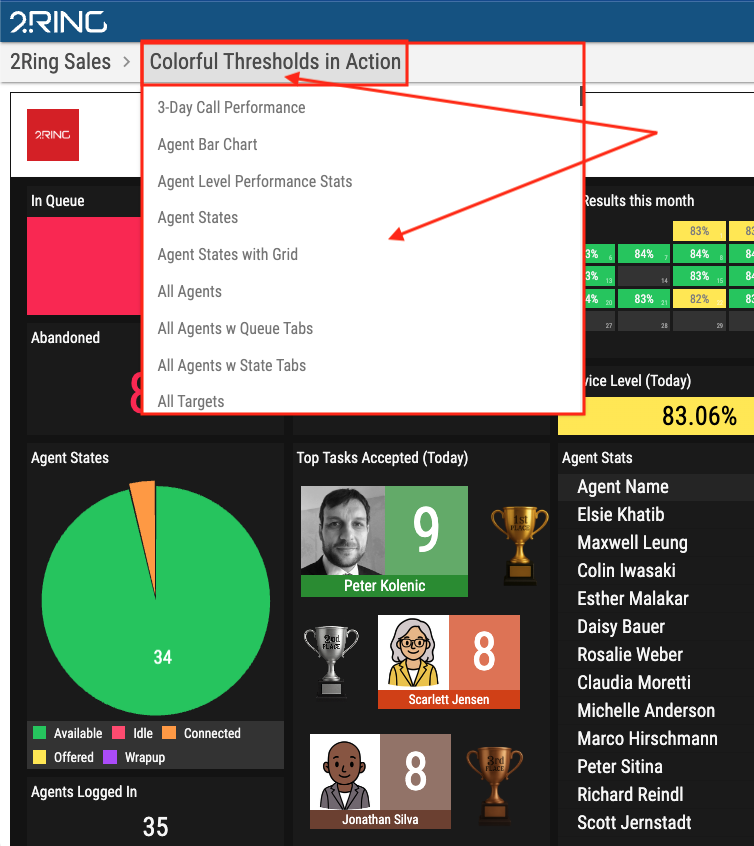
Layouts now work in the same way. The name of the current layout shown rumb is clickable, so you can jump from one layout to another in a single step.
Instead of returning to a selection screen, click the layout name, pick another layout from the list and it opens right away. This keeps navigation quick when you compare or cycle through several layouts.
How to use it
Click the name of the current layout in the breadcrumb at the top of the screen.
Choose another layout from the list that appears.
The selected layout opens immediately, ready to view.
Figure 10: Quick Layout Switching from the top of the screen
9. Introducing AI Assistant Data
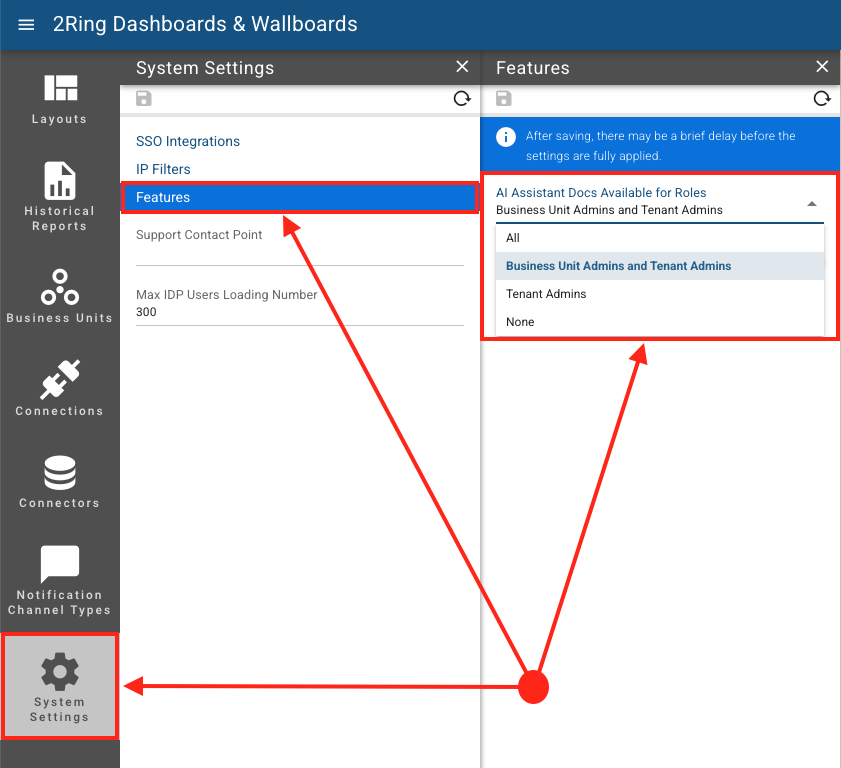
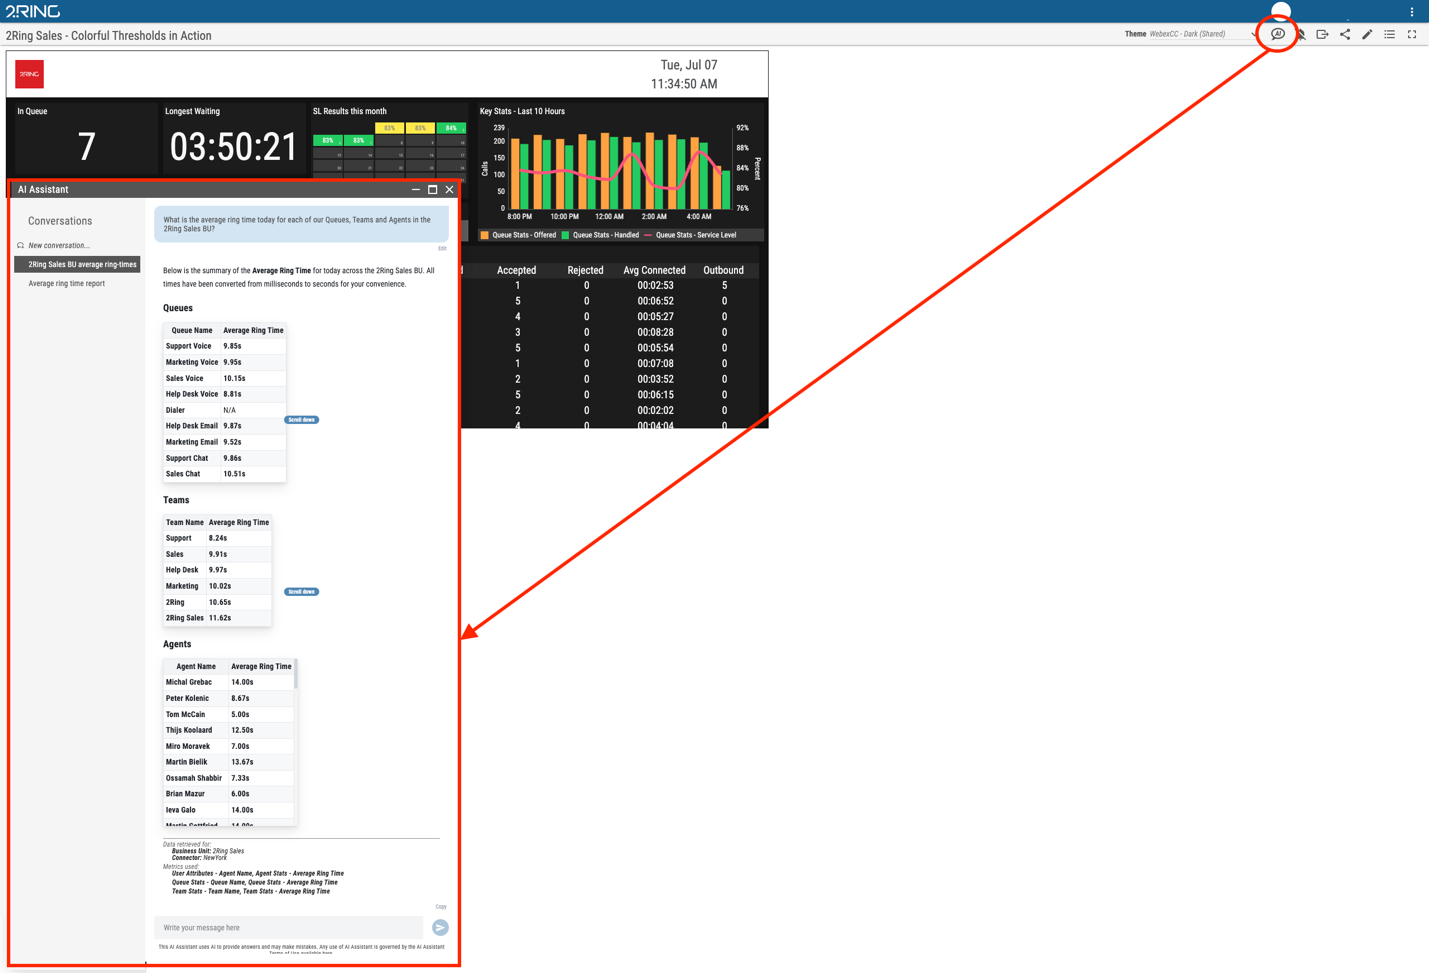
AI Assistant Docs has been answering questions about 2Ring Dashboards & Wallboards. Now, with the introduction of AI Assistant Data, users can also ask questions about the data they have access to, served through the real time data engine. Support for the Historical Reporting Module is on the product roadmap. Answers include the calculation steps that were used, so you can verify that the right metric was chosen.
Figure 11: AI Assistant Data answering a question about live contact center data
Sample prompts to get you started
What is the current Service Level of our ServiceDesk team?
How long does a customer wait on average before reaching a service representative?
What is the average ring time today for each of our Queues, Teams and Agents?
What have been the most common Idle Reason Codes today?
What are the top 3 wrap up codes used today?
What is the average queue time of abandoned calls today, and does it differ per queue?
Rank all our queues by the number of abandoned calls.
Which agent has received the most agent to agent transfers?
Rank agents by the total time spent talking to customers.
Plus many more.
Figure 12: AI Assistant Data answering a question about live contact center data
10. AI Assistant on Mobile
Now that the AI Assistant can bring answers straight from your data, it makes sense to have it on the go. The AI Assistant is now available in the mobile version, so you can fire off quick questions from your phone. All the same security controls apply, keeping you safe and respecting your choices about AI feature availability.
Where to find it
Open Dashboards & Wallboards on your mobile device.
Open the AI Assistant.
Type your question and review the answer.
Figure 13: AI Assistant on the mobile device

11. License Handling
Licensing now behaves more predictably around expiry, with clear notice and a grace period before data processing stops.
An expiration notification is shown by default 5 days before the expiration date.
After expiration, the 2Ring connector keeps running and calculating data for 28 days. Data processing stops at the end of that period.
The purge process runs on the last day of the month that follows the month in which the subscription expired.
12. Connector Updates
This release brings a range of improvements across the connectors.
See also https://docs.2Ring.cloud
Amazon Connect Connector
The connector now supports consuming up to three Kinesis streams.
WebexCC Connector
Skills Statistics.
Skills Agent States.
Track various idle reasons and percentage of time.
Support for Granular agent state control across all four channels: voice, chat, email and social.
Abandoned Contacts Grid.
Agent Session Collaboration Statistics.
Agent Session Outdial Statistics.
Agent Session Outdial Collaboration Statistics.
Queue Collaboration Statistics.
Queue Monitoring Statistics.
Added support for agent based queue routing.
ZOOMCC Connector (Beta)
A new ZOOMCC connector is now available in beta. It currently covers these areas:
Agent States.
Agents Time Sheet Statistics.
Completed Engagements.
Current Engagements.
Queue Statistics per Email, Messaging, Video and Voice.
NICE CXone Connector
Added support for digital channels, alongside the existing legacy channels.
Genesys Cloud Connector
New Presence Label column in the Agent States Active Grid.
Added Recent and Current Interactions.
Added a Wrap Up state to the Routing Status and Status columns in the Agent States Active Grid.
Five9 Connector
The settings for communicating with the source Five9 instance can now be managed by the tenant administrator. Customers can proactively change expiring passwords without raising a support ticket.
Added support for parallel calculation execution.
The minimum value for the Run Report Interval setting was lowered from 5 to 0.
New Max Concurrent Calculations setting.
Fixed an issue where the daily WebSocket reconnection could happen at a different time than expected.
Extended Reporting Grid intervals beyond the previous real time and hourly options, for more flexible reporting schedules:
Daily intervals of 1 to 7 days.
Weekly intervals of 1 to 4 weeks.
Monthly intervals.
13. Forward Audit Logs to Your SIEM or Log Aggregator
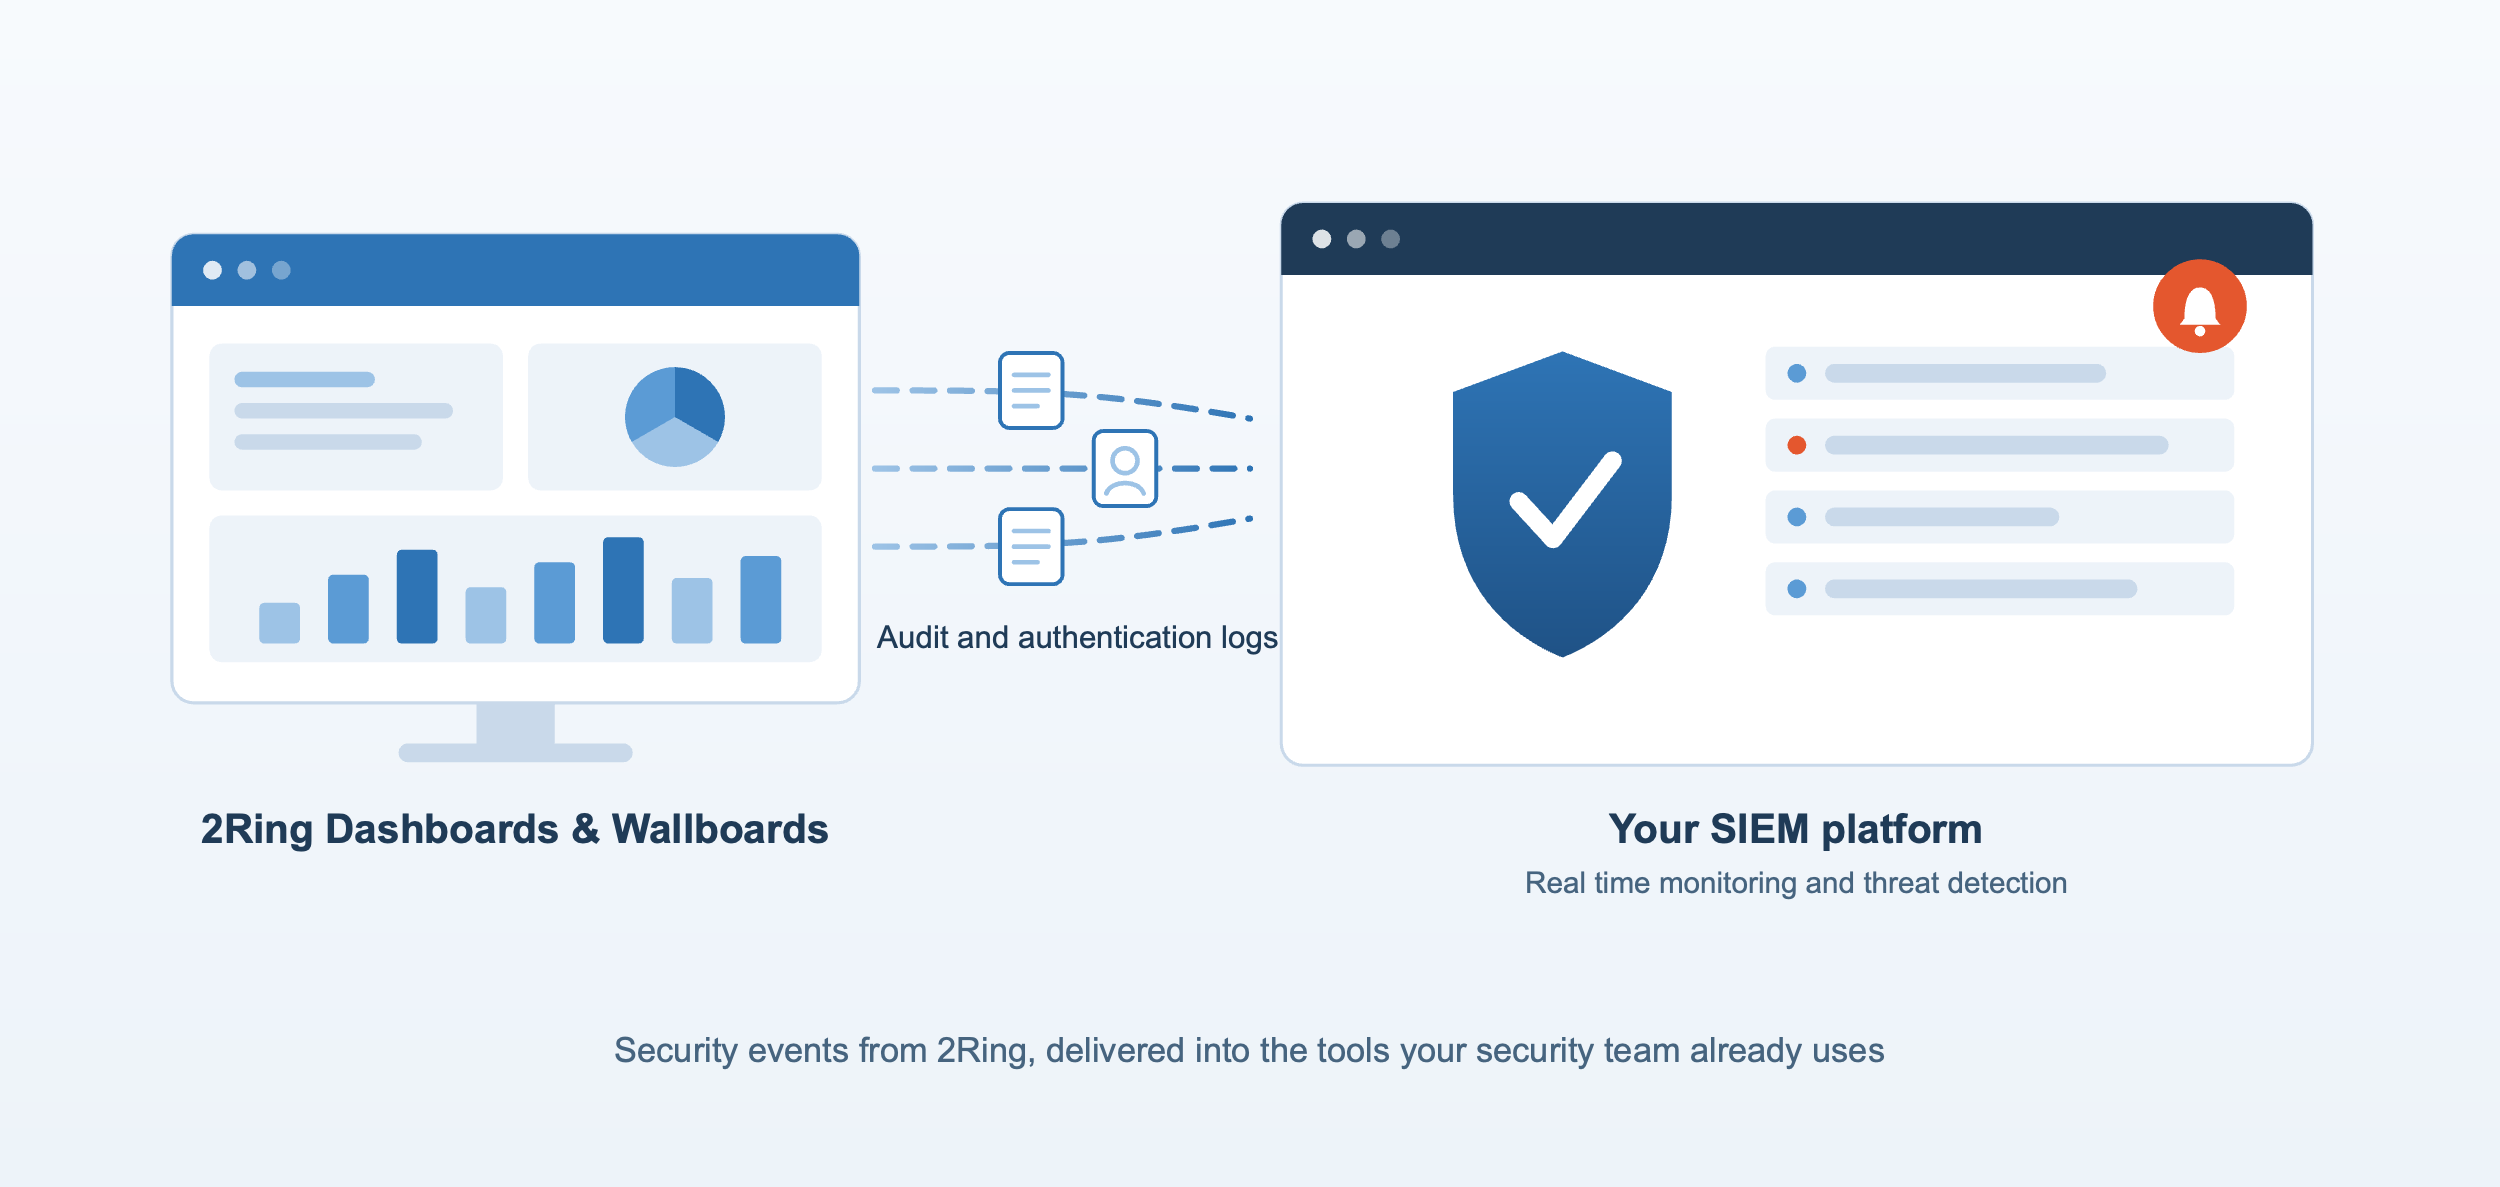
You can now forward audit and authentication logs from your Dashboards & Wallboards instance straight to your SIEM platform. Critical security events flow into your existing alerting pipeline for real time monitoring and threat detection, so your security team sees activity from 2Ring alongside everything else they already watch. Log forwarding is available for platforms such as Splunk, for a complete up to date list contact us at sales@2ring.com.
How to set it up
Contact your account team or 2Ring Support to request log forwarding to your platform.
Agree on the destination and the events to forward. Filtering can be applied on the 2Ring side or on your side.
Confirm that events are arriving in your SIEM.
Figure 14: Audit log forwarding to a SIEM platform
If you configure toast alerts and they do not appear, check your browser for a bell icon, click on it and follow the instructions provided by the browser.
For more information, see Log Forwarding chapter.
Need help with any of these features? Reach our team through Support Contacts.