Agent Performance
The Agent Performance report is an Interactive Report that provides an overview of historical performance metrics for agents. It focuses on agent-level activity, workload, states, utilization, and time-based distributions across multiple analytical pages.
This report supports interactive analysis, filtering, drill-through navigation, and exporting.
Available Pages
The Agent Performance report consists of the following pages:
Main
Intervals
Volume
Wrapups
States
Utilization
Idle States
Averages
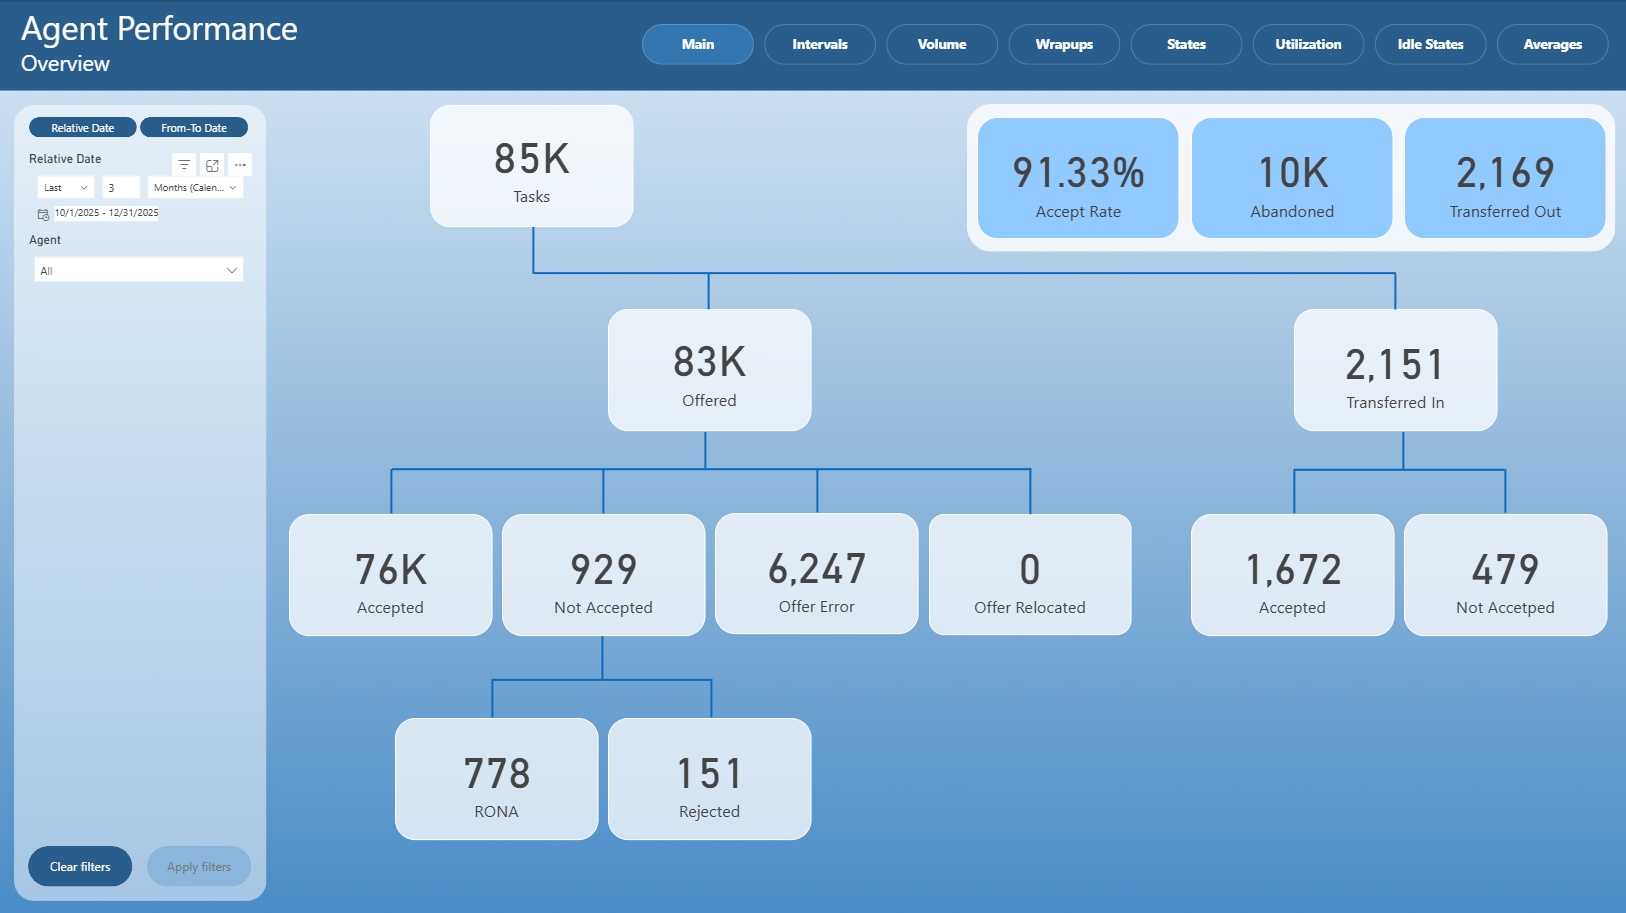
Main
The Main page provides a high-level overview of agent performance for the selected time period.
It visualizes the overall task flow and key performance indicators, including:
Total tasks
Offered and accepted tasks
Not accepted and error-related outcomes
Transferred in and transferred out tasks
Accept rate and abandoned metrics
The layout emphasizes the relationship between offered, accepted, and transferred tasks using a flow-style visualization.
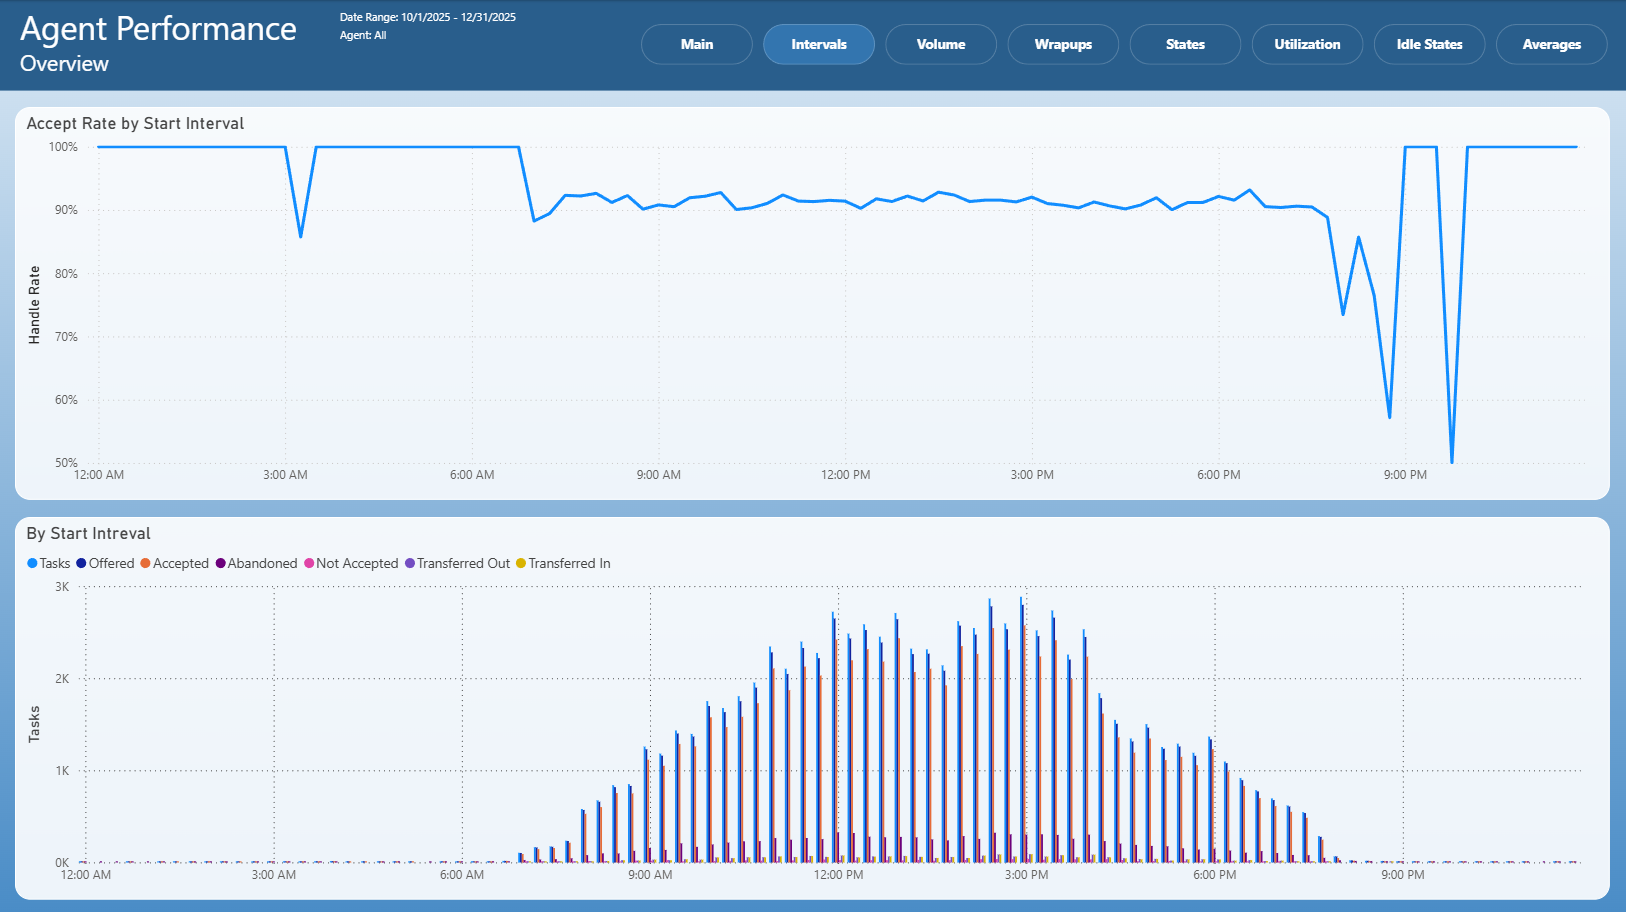
Intervals
The Intervals page focuses on time-based analysis using start intervals.
It typically includes:
Accept rate trends by start interval
Task volume distribution by interval
Comparison of offered, accepted, abandoned, and transferred tasks over time
This page helps identify performance patterns and fluctuations throughout the day.
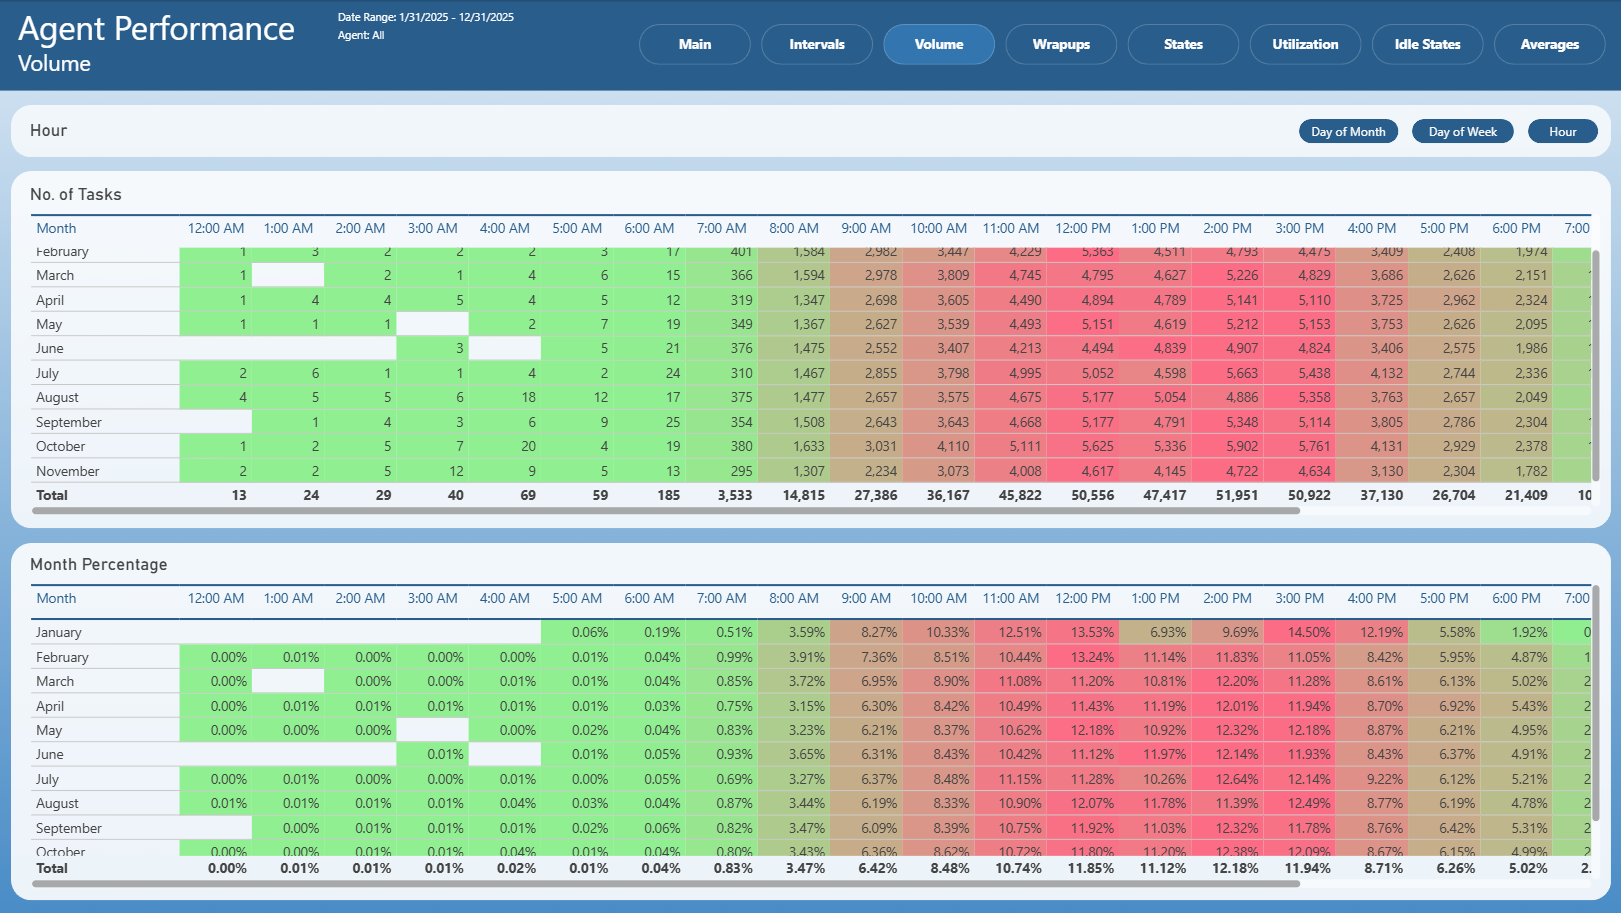
Volume
The Volume page provides a detailed view of task volume distribution across time dimensions.
It includes:
Number of tasks grouped by hour
Monthly comparison of task volumes
Percentage distribution of tasks across time periods
Users can switch between different time perspectives (for example hour, day of week, or day of month).
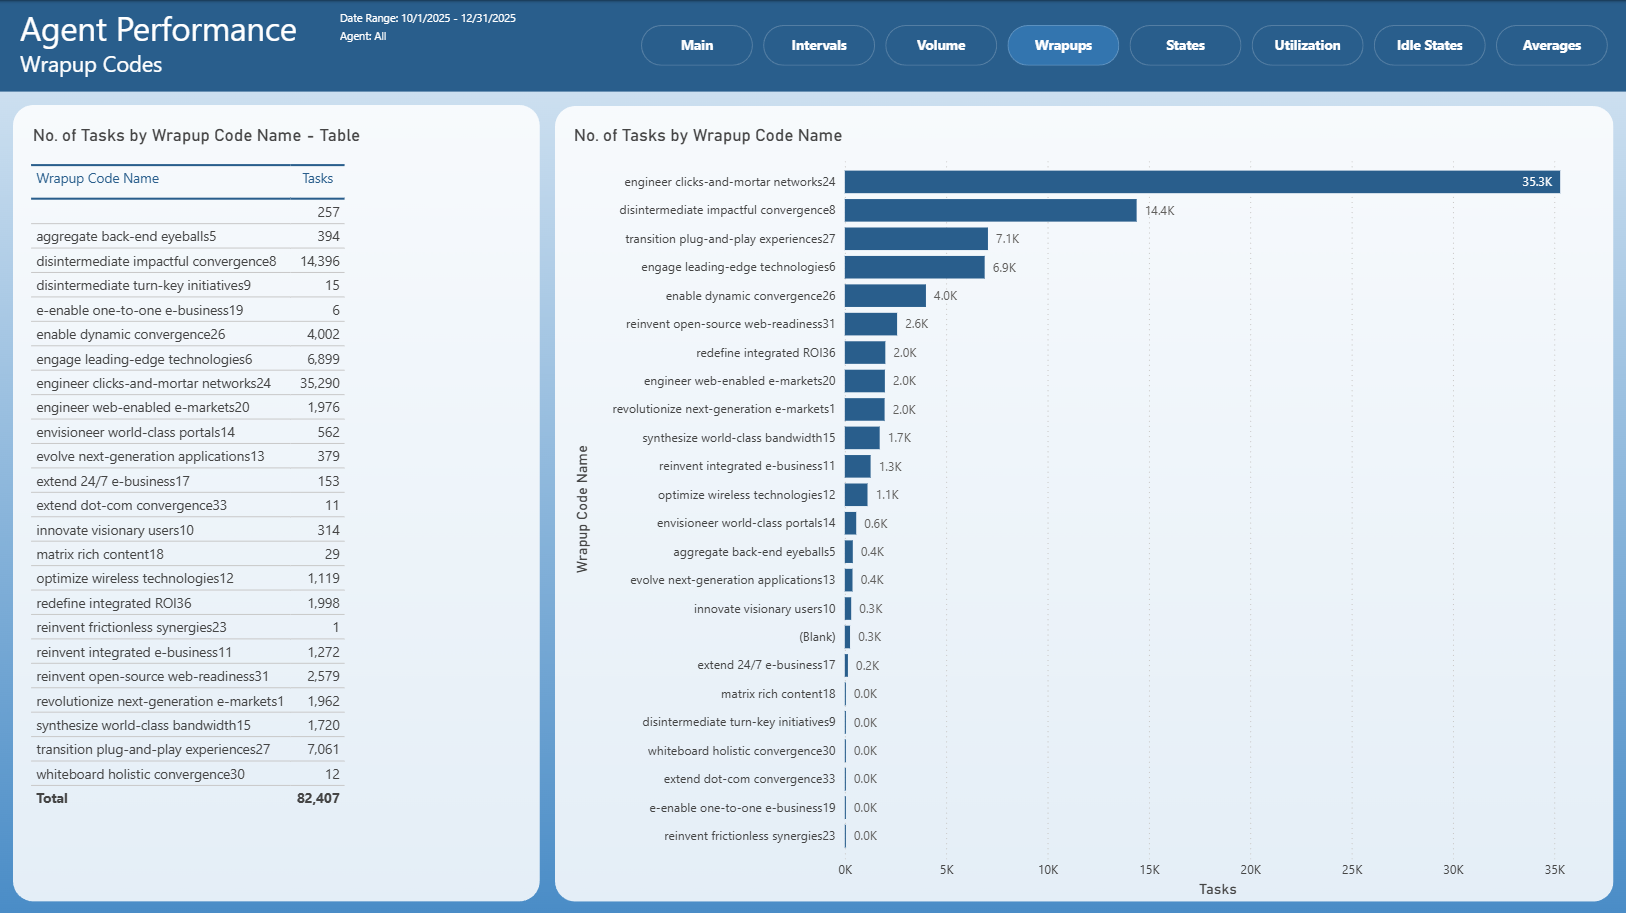
Wrapups
The Wrapups page analyzes tasks based on wrap-up codes.
It typically includes:
A table listing wrap-up codes with task counts
A visual comparison of wrap-up code usage
Identification of the most frequently used wrap-up codes
This page helps understand how tasks are categorized after completion.
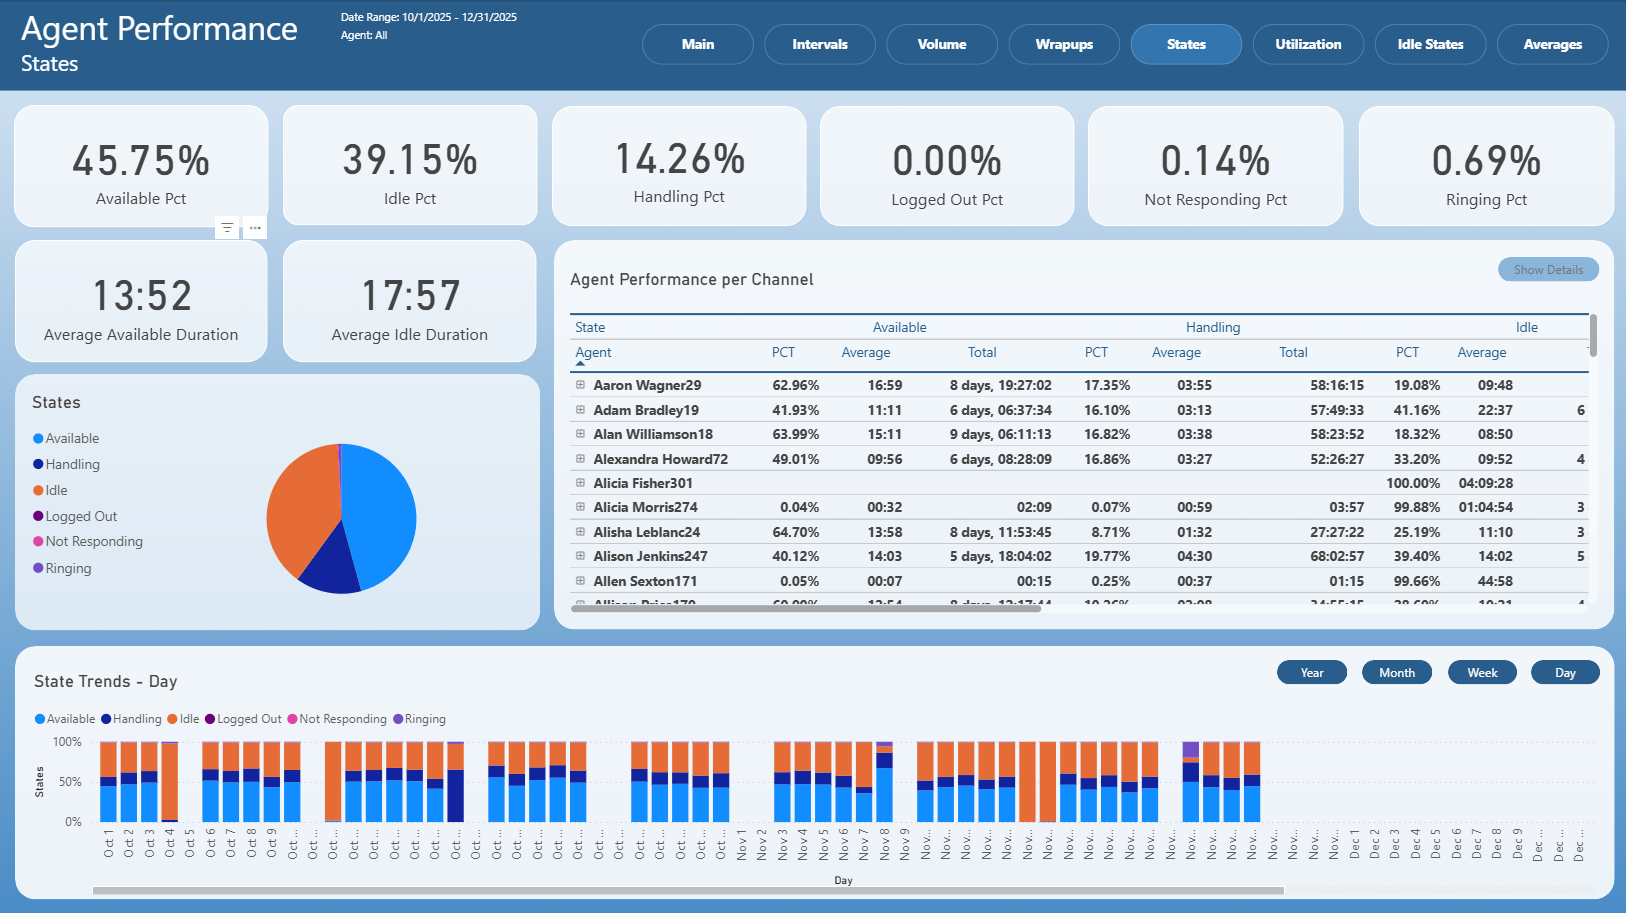
States
The States page provides insight into agent states and their distribution.
It includes:
Percentage breakdown of agent states
Average durations for selected states
Agent performance per channel
State distribution visualizations
State trends over time
This page helps analyze how agents spend their working time.
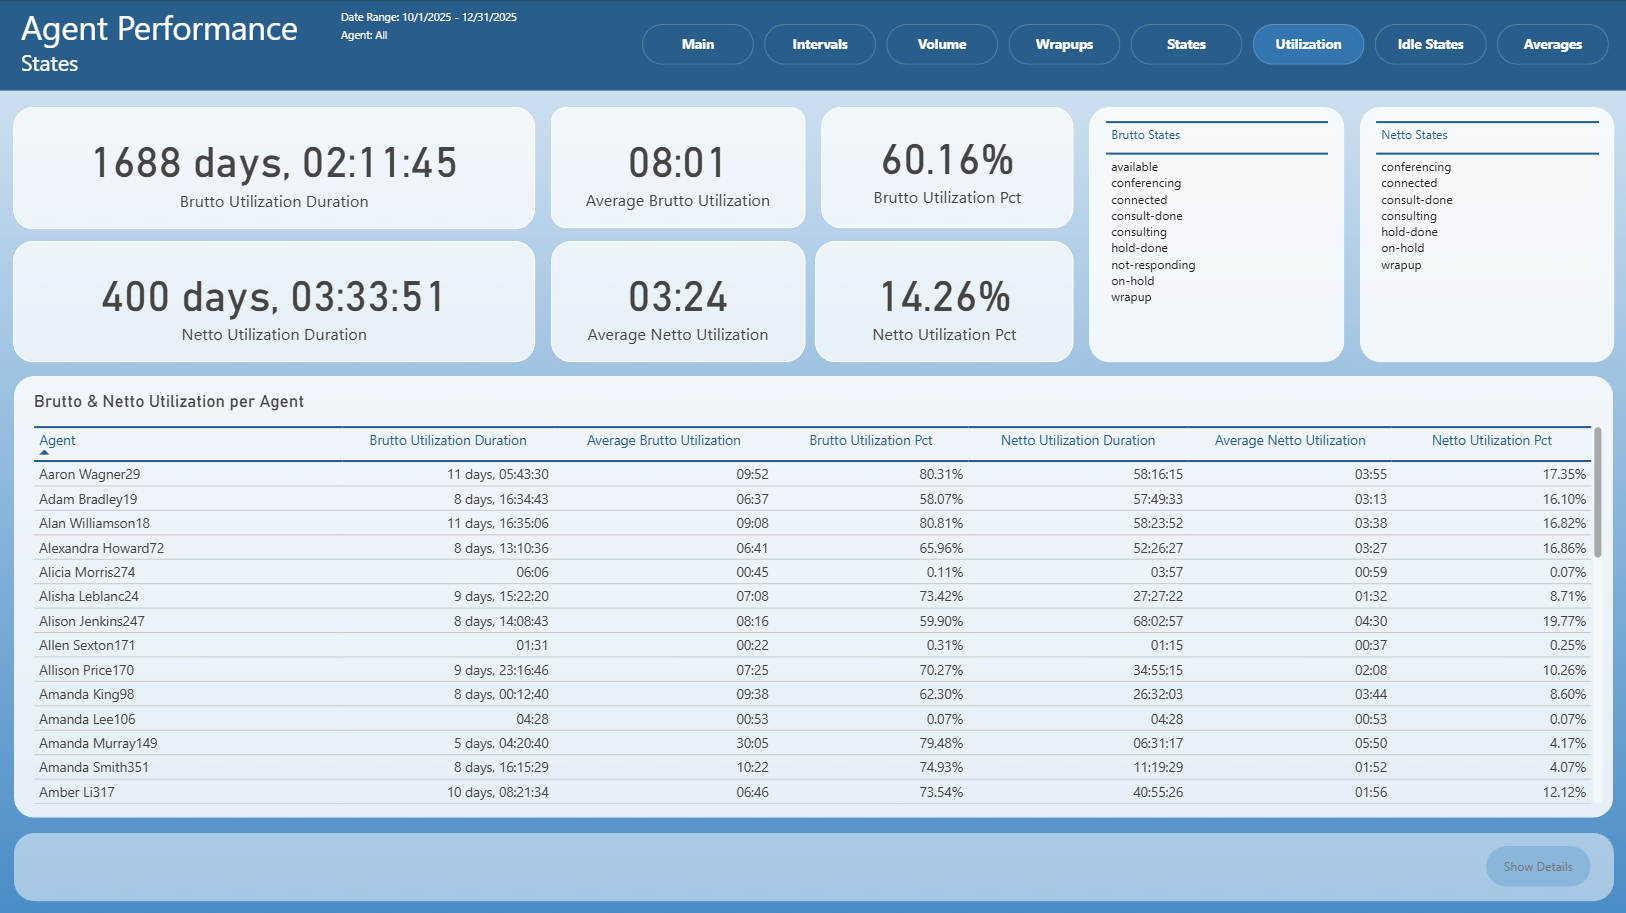
Utilization
The Utilization page focuses on agent utilization metrics.
It includes:
Brutto and netto utilization durations
Average utilization values
Utilization percentages
Comparison of utilization per agent
Definitions of states included in brutto and netto utilization
This page is used to evaluate agent workload and efficiency.
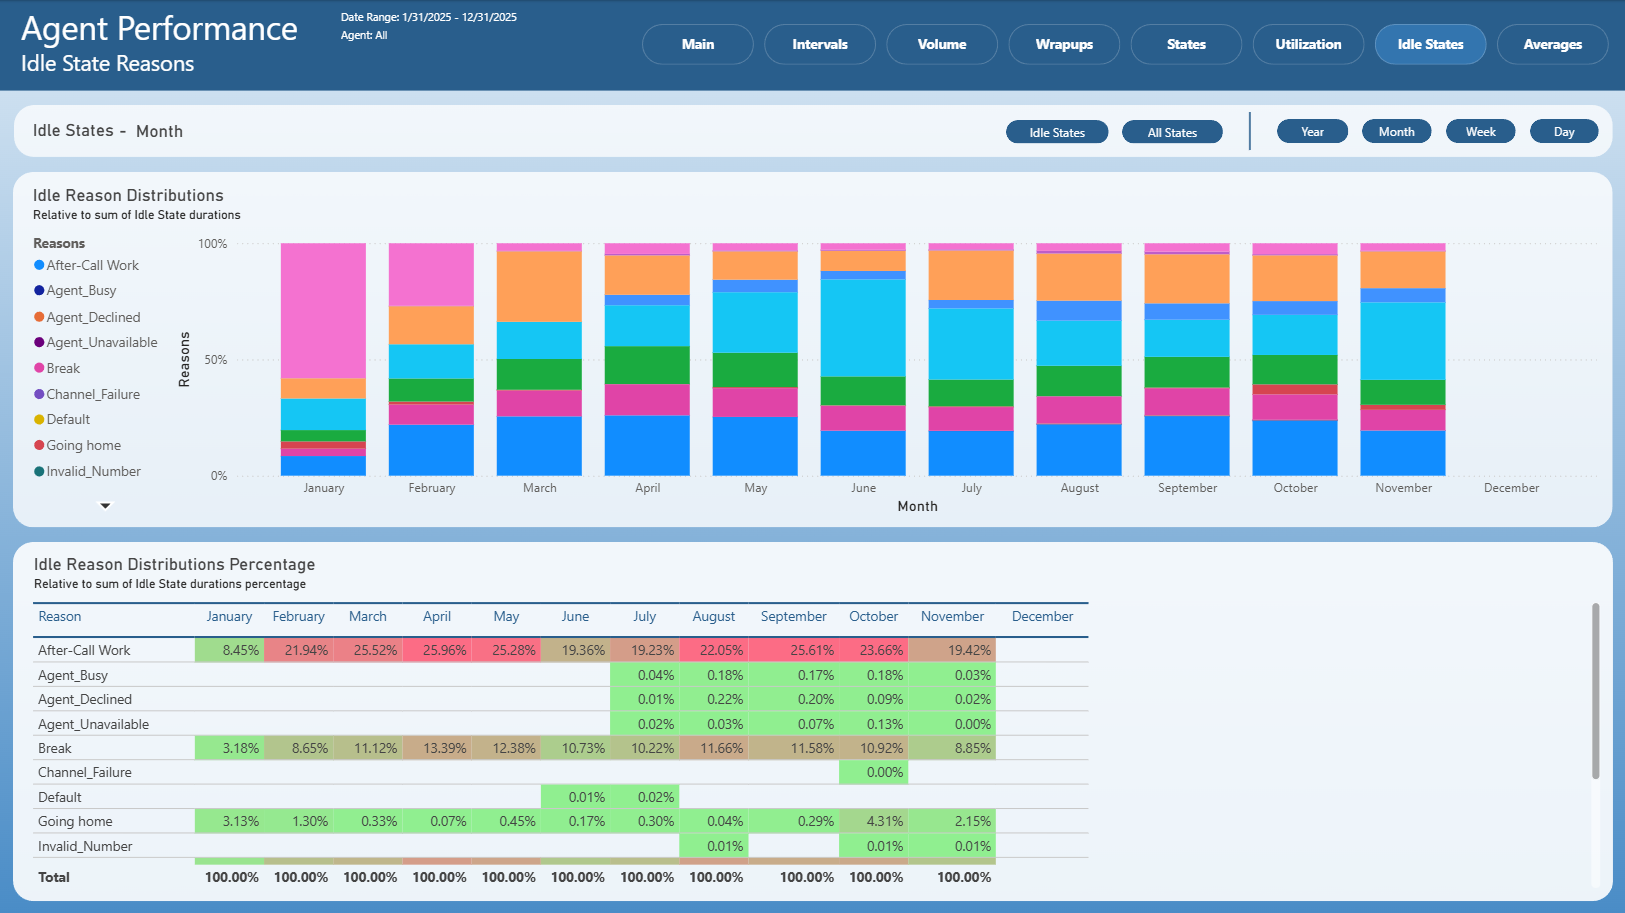
Idle States
The Idle States page analyzes idle time and idle state reasons.
It includes:
Distribution of idle state reasons
Percentage breakdown of idle durations
Time-based views (year, month, week, day)
This page helps identify the primary reasons for agent idle time.
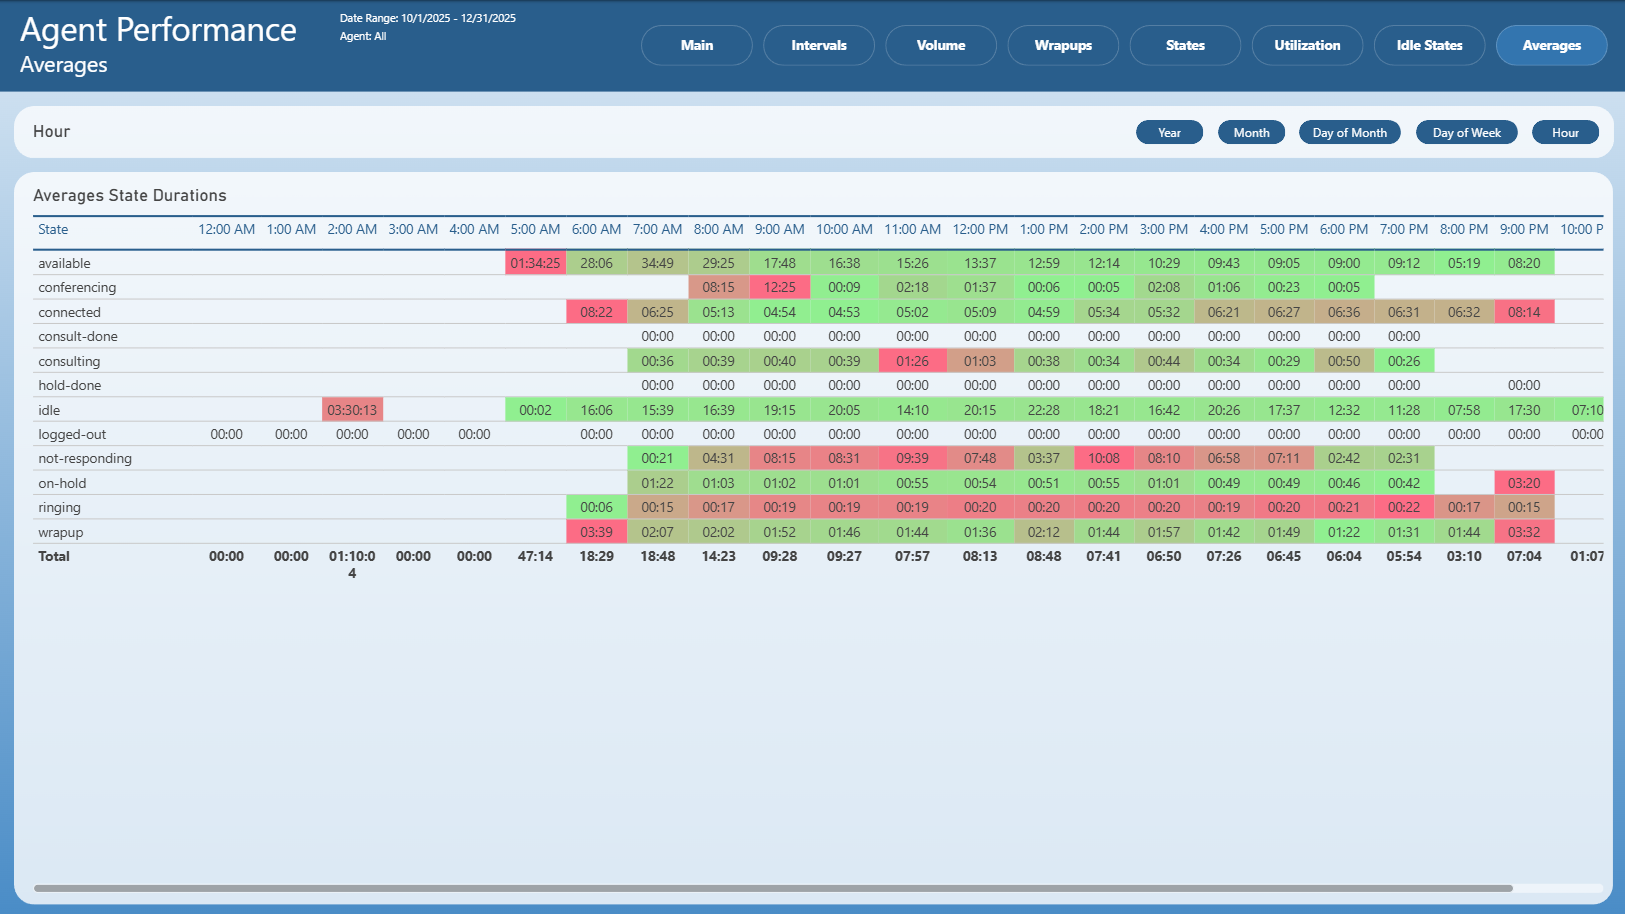
Averages
The Averages page provides average state duration metrics across time intervals.
It includes:
Average duration per state
Hour-based breakdown of state durations
Comparative view across different states and time periods
This page supports detailed analysis of how long agents spend in individual states on average.
Notes
This is an Interactive Report
All pages respect the applied filters
Drill-through options may be available on selected visuals
Exporting follows standard Power BI export behavior