Tasks Abandoned
The Tasks Abandoned report is an Interactive Report that provides insight into interactions that were abandoned before being handled by an agent. It focuses on the volume, distribution, and trends of abandoned tasks across organizational dimensions and time.
This report is intended for identifying abandonment patterns, peak abandonment periods, and potential capacity or routing issues.
Available Pages
The Tasks Abandoned report consists of the following pages:
Main
Details
Month Comparison
Volume
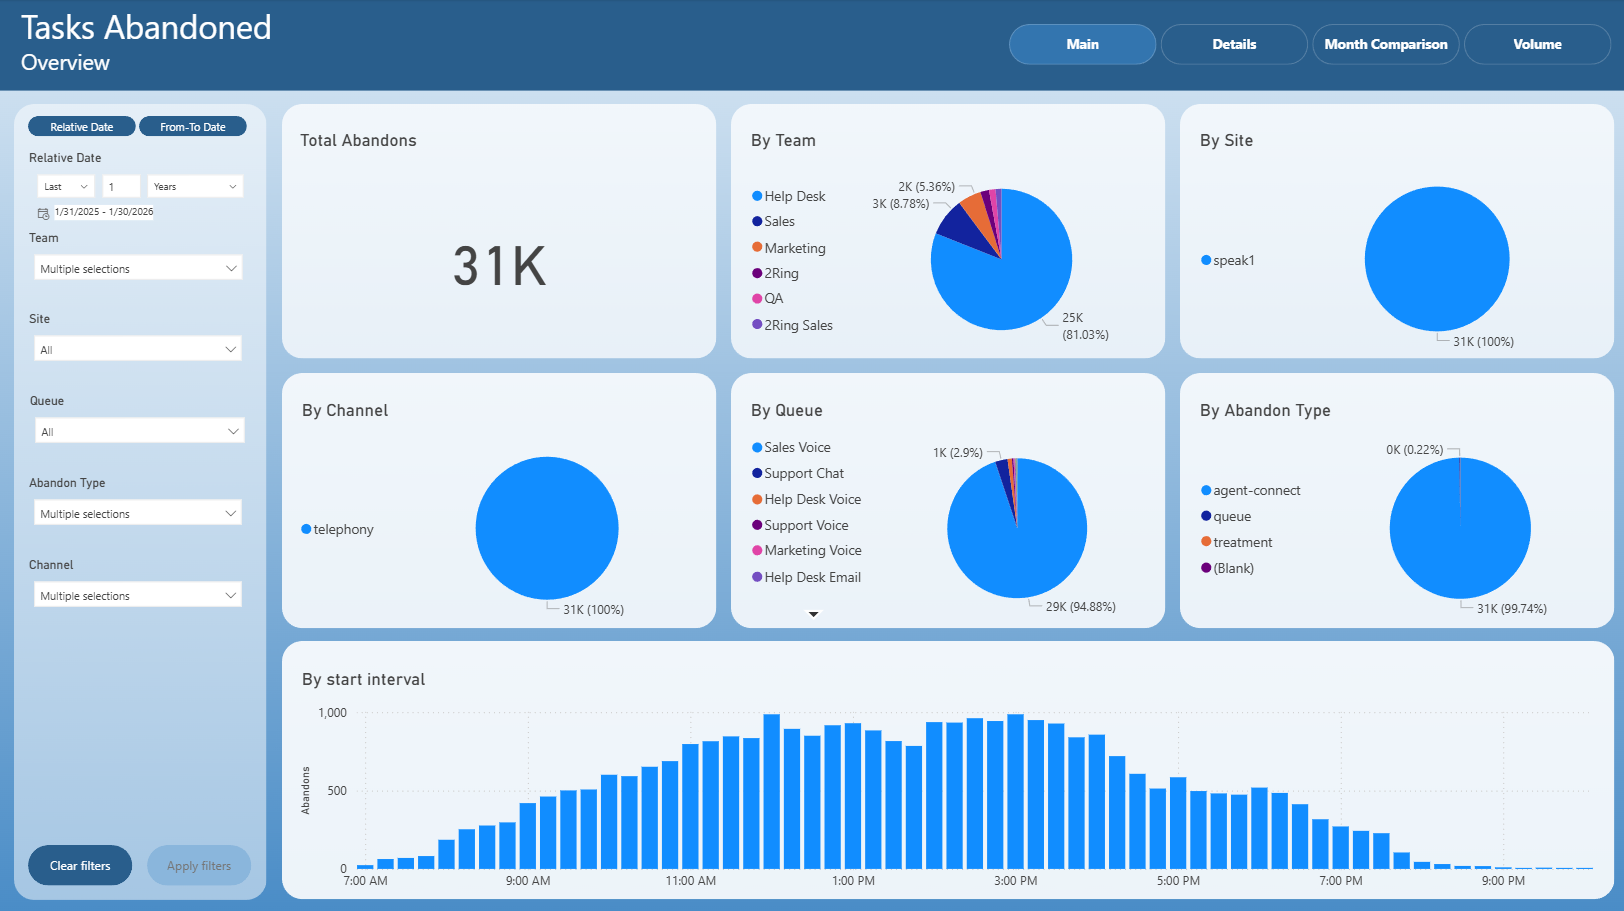
Main
The Main page provides a high-level overview of abandoned tasks for the selected time period.
It includes:
Total number of abandoned tasks
Distribution of abandoned tasks by team
Distribution by site
Distribution by channel
Distribution by queue
Distribution by abandon type
Abandoned tasks by start interval
This page is intended for quick identification of where and when abandonments most frequently occur.
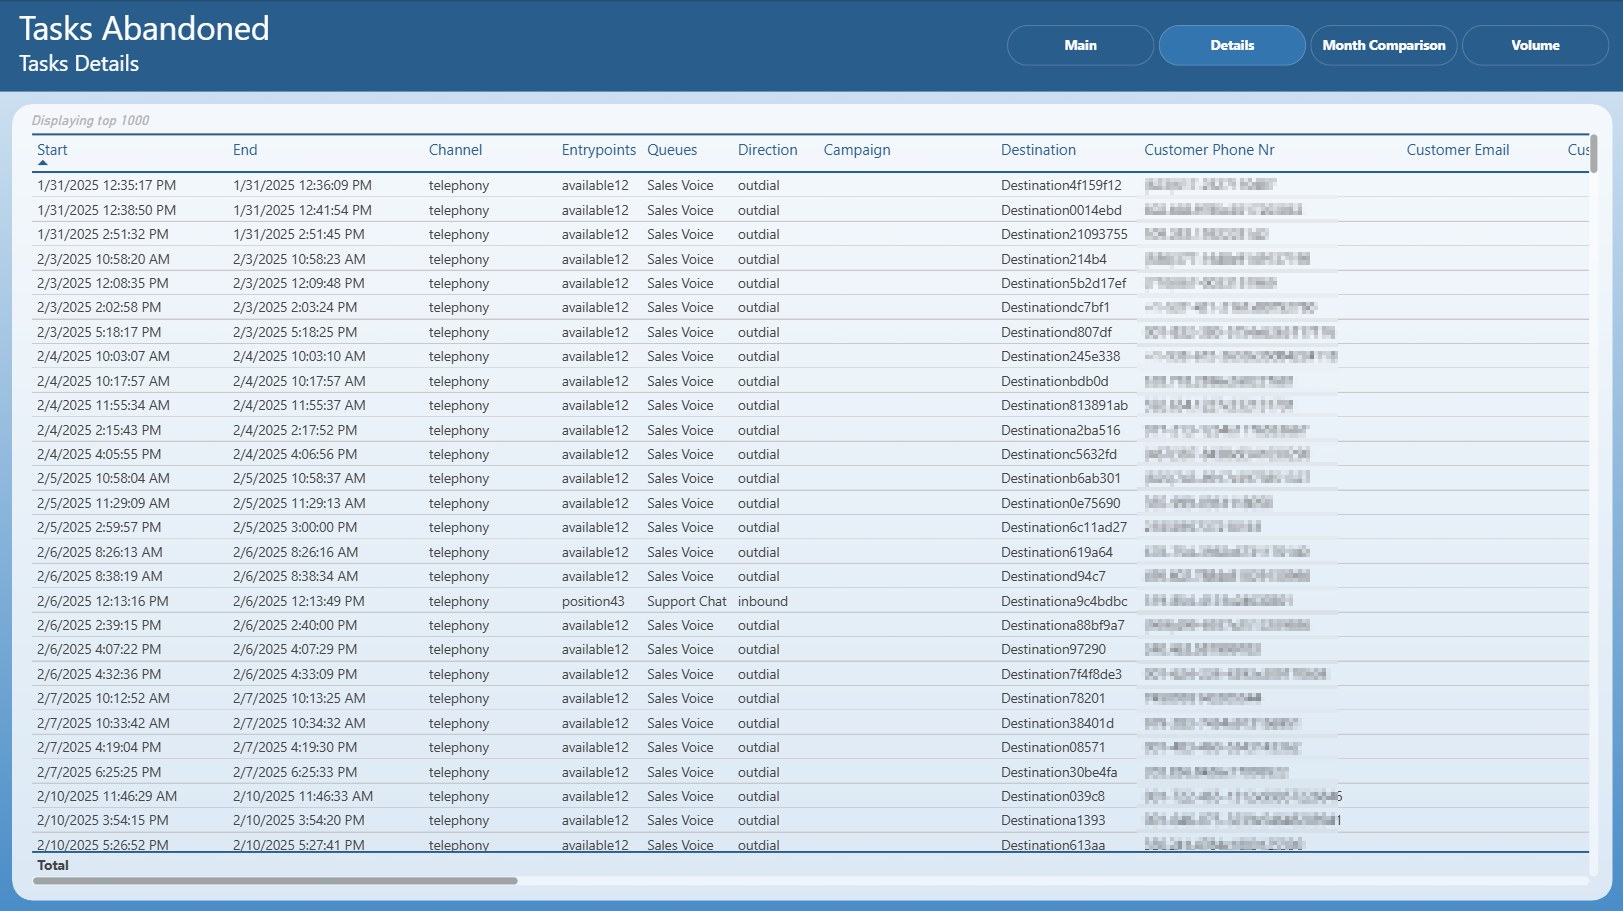
Details
The Details page presents task-level information for abandoned interactions.
It includes:
Task start and end timestamps
Communication channel
Entry points and queues
Interaction direction
Campaign and destination details
Customer phone number and email (where available)
This page is primarily used for detailed investigation and auditing of individual abandoned tasks.
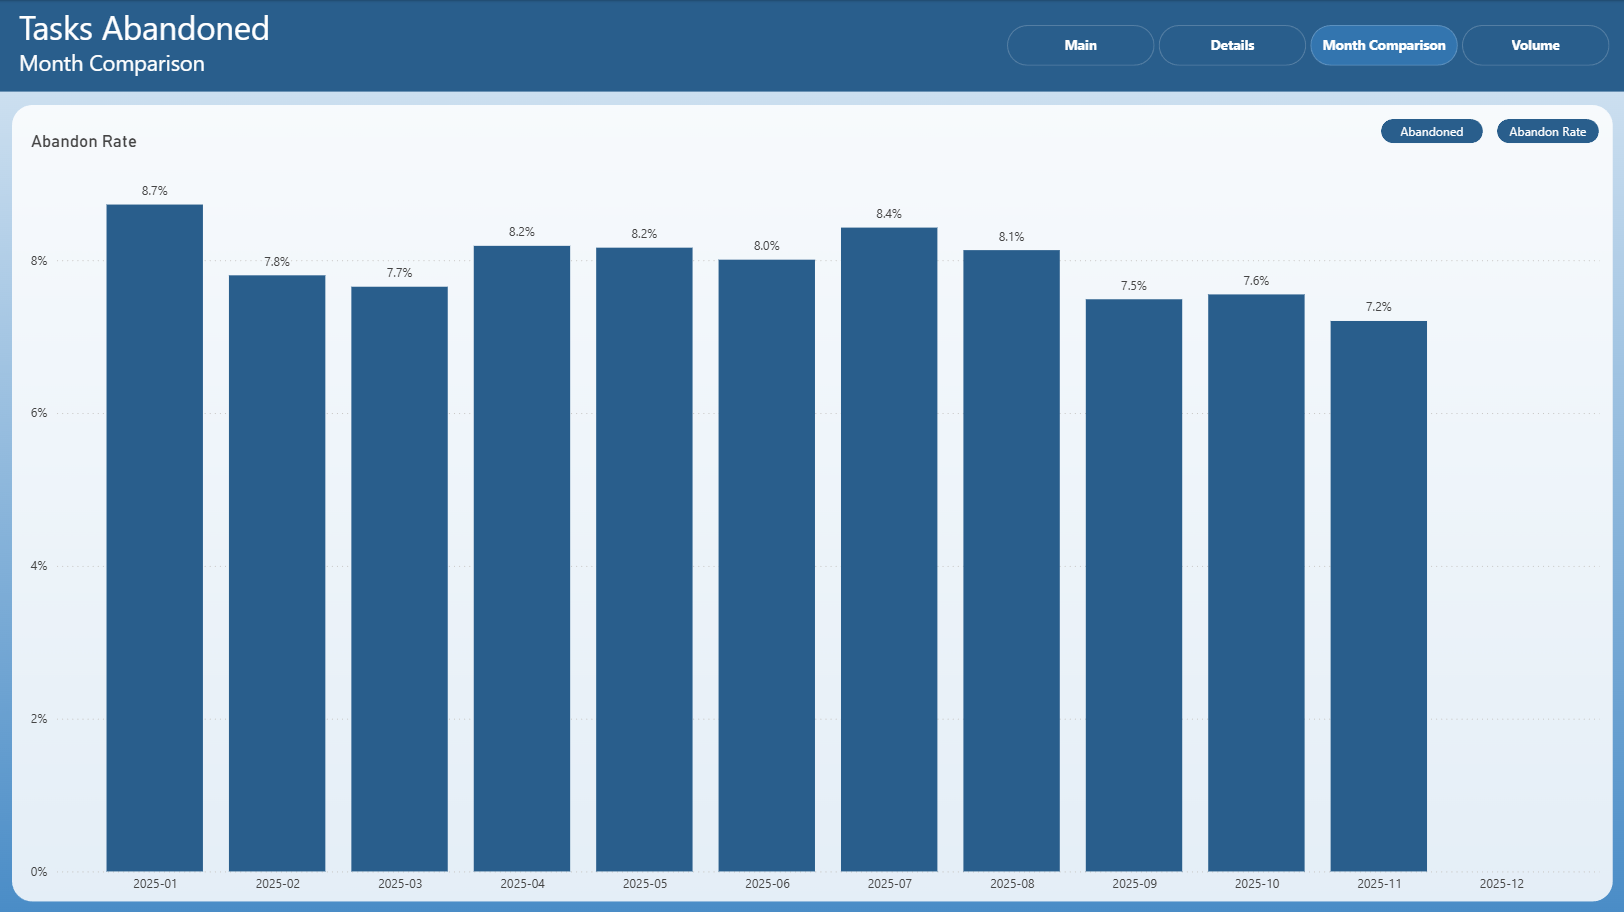
Month Comparison
The Month Comparison page focuses on comparing abandonment metrics across months.
It presents:
Total abandoned tasks by month
Comparative view of abandonment trends between months
Option to switch between absolute abandoned counts and abandon rate
This page is useful for identifying month-over-month changes and seasonal patterns in abandonment behavior.
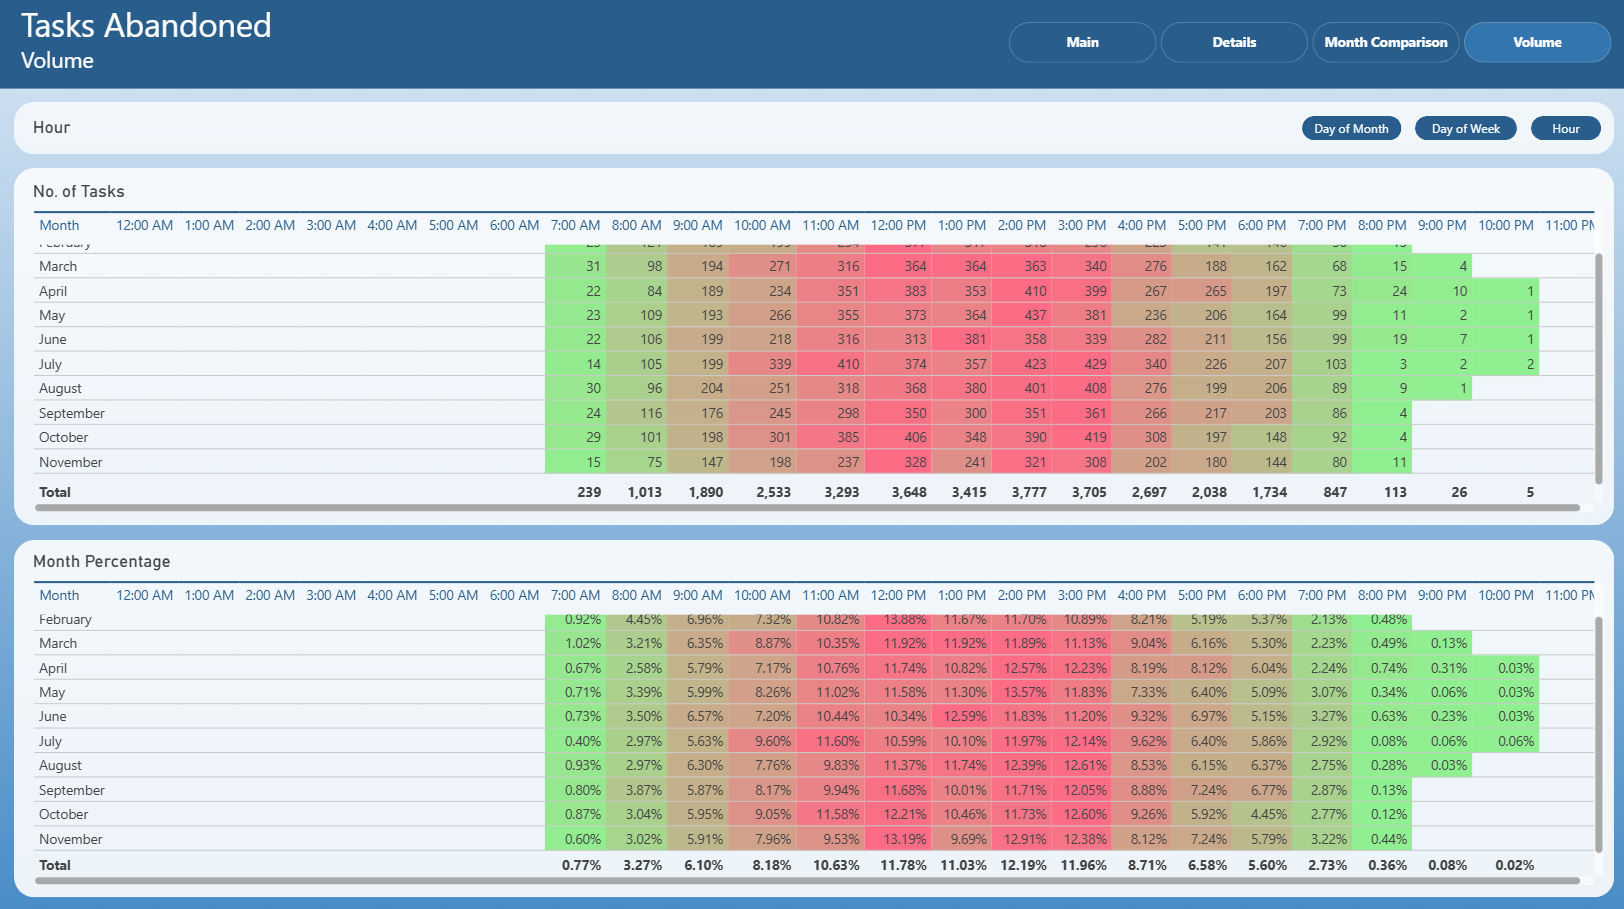
Volume
The Volume page provides a time-based breakdown of abandoned task volume.
It includes:
Number of abandoned tasks by hour
Hourly distribution broken down by month
Percentage-based abandonment distribution by hour
Heatmap-style visualization highlighting peak abandonment periods
This page helps identify daily and hourly peaks where abandonment is most prevalent.
Notes
This is an Interactive Report
All pages respect the applied filters
Drill-through actions may be available from selected visuals
Exporting follows standard Power BI export behavior