Tasks Incoming
The Tasks Incoming report is an interactive report focused on analyzing incoming task demand and how this demand is distributed, accepted, and handled across teams, queues, channels, and time intervals.
The report helps supervisors and operations teams understand:
overall incoming workload,
task acceptance behavior,
Ring No Answer Rate (RONA),
talk and wait time trends,
wrapup code usage,
time-based volume distribution.
Available Pages
The Tasks Incoming report contains the following pages:
Main
Tasks Details
Month Comparison
RONA Rate
Avg. Talk Time
Avg. Wait Time
Wrapups
Volume
Main
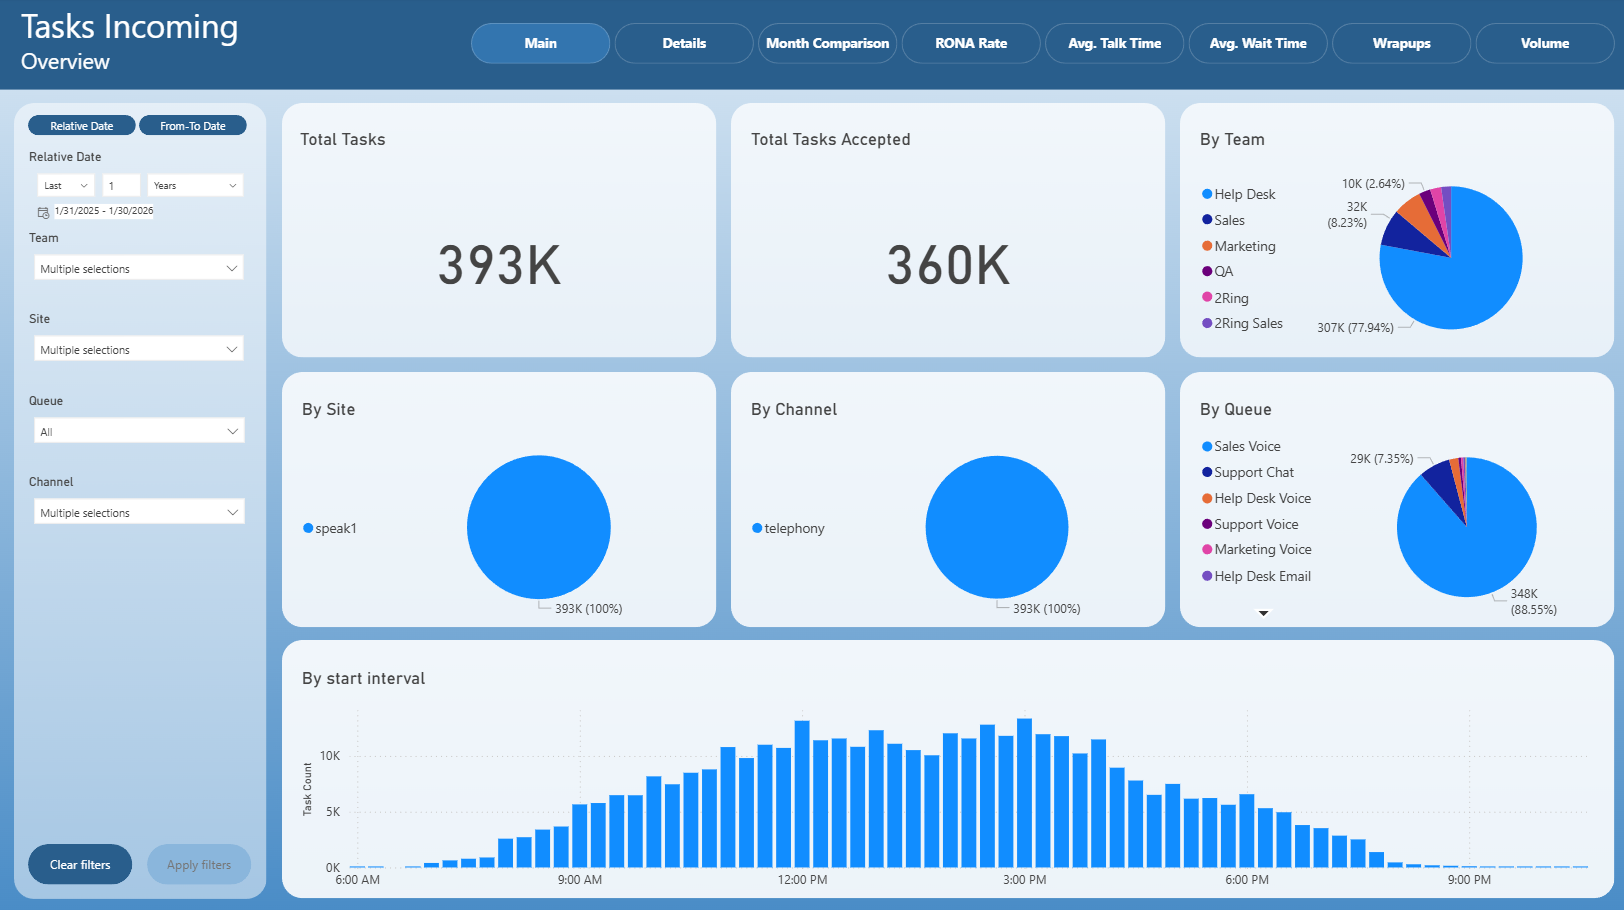
The Main page provides a high-level overview of incoming tasks within the selected time range.
It includes:
Total Tasks – total number of incoming tasks.
Total Tasks Accepted – number of tasks successfully accepted by agents.
By Team – distribution of incoming tasks by team.
By Site – distribution of tasks by site.
By Channel – distribution by communication channel.
By Queue – distribution by queue.
By start interval – task volume grouped by task start time, showing daily demand patterns.
This page is typically used for quick operational monitoring and demand assessment.
Tasks Details
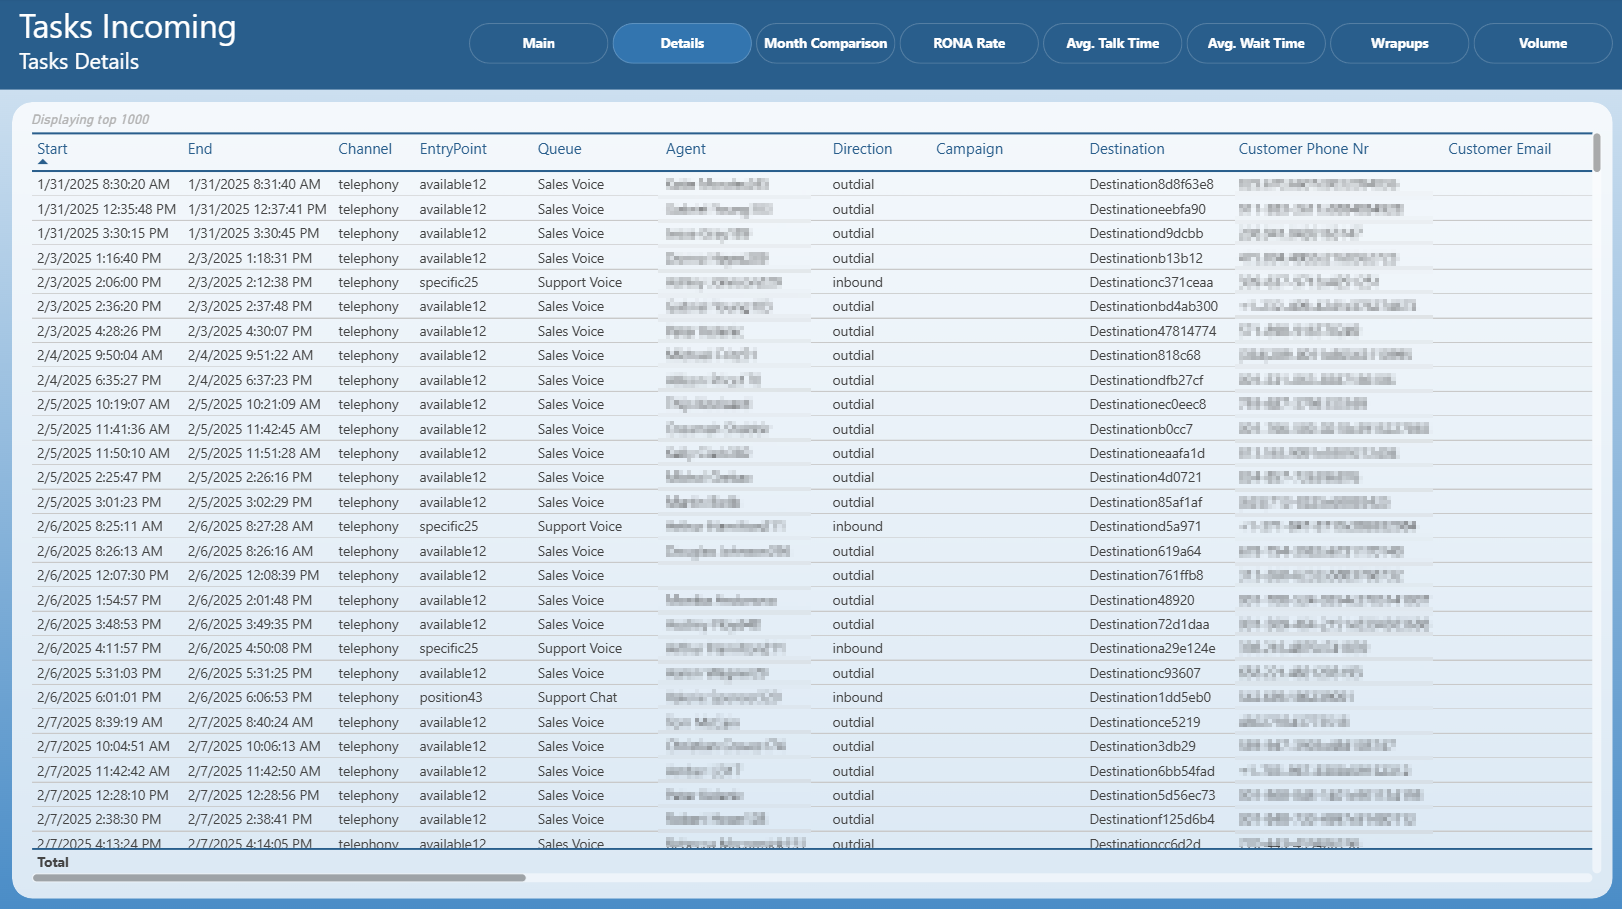
The Tasks Details page displays a detailed table of individual incoming tasks.
For each task, it shows:
start and end time,
channel,
entry point,
queue,
agent,
direction,
campaign,
destination,
customer phone number and email.
This page is intended for detailed investigation, auditing, and troubleshooting of specific tasks.
Month Comparison
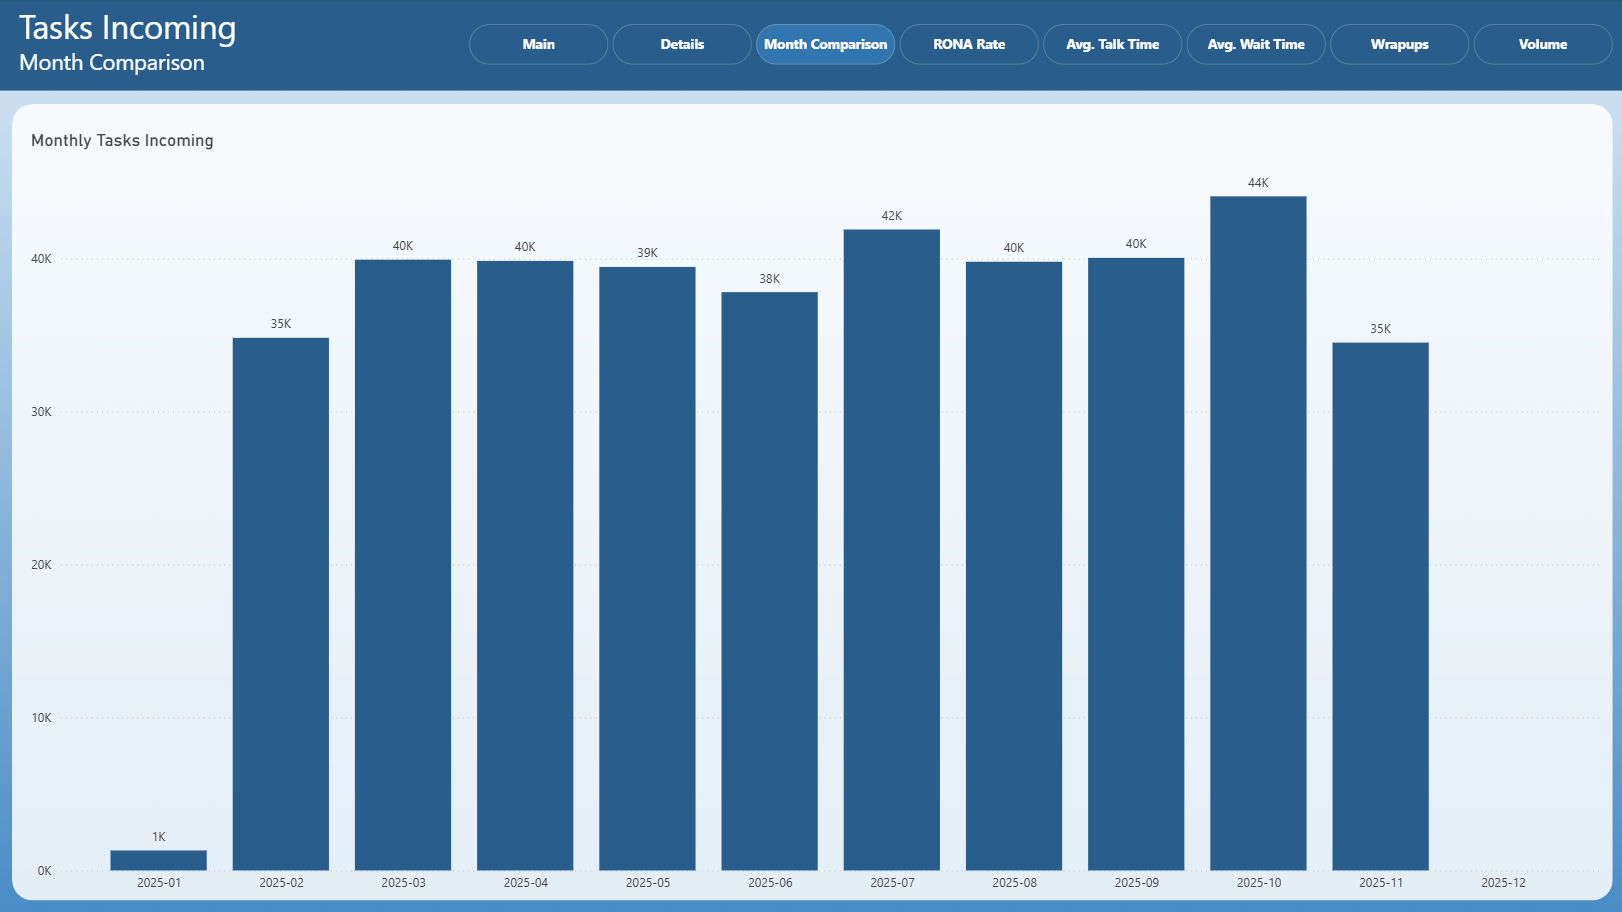
The Month Comparison page compares the total number of incoming tasks across months.
It allows users to:
identify long-term demand trends,
compare workload between months,
detect seasonal or volume-related changes.
Ring No Answer Rate (RONA)
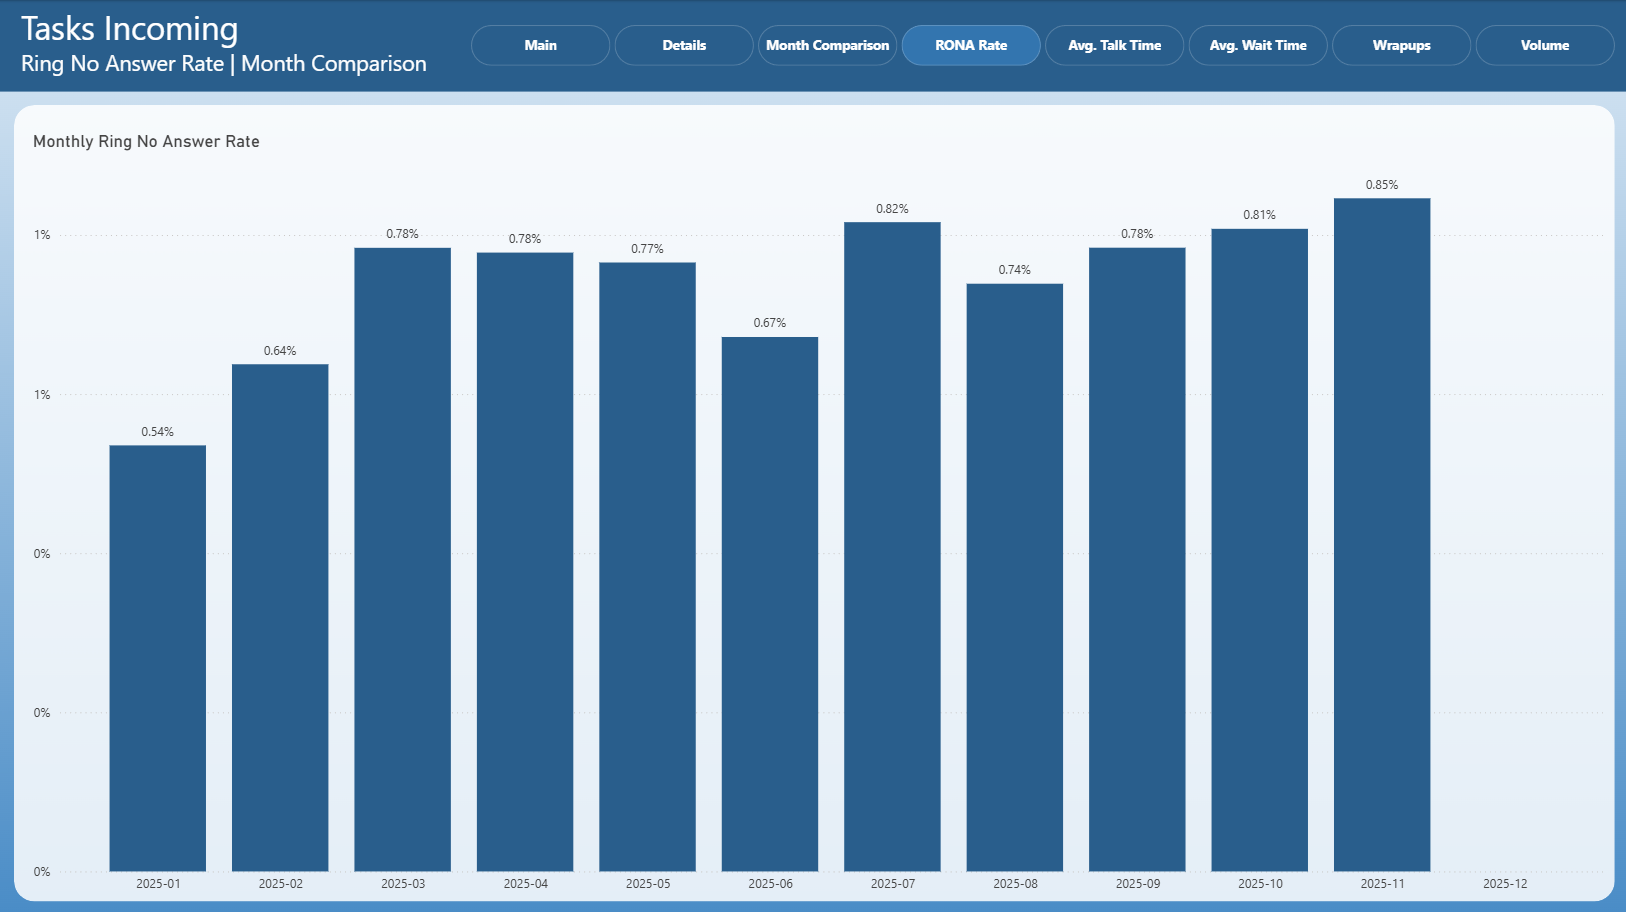
The RONA Rate page displays the Ring No Answer Rate for incoming tasks on a monthly basis.
RONA represents tasks that were offered to agents but not answered within the allowed time window.
This page helps identify:
agent availability issues,
routing or staffing inefficiencies,
periods with increased missed task rates.
Average Talk Time | Month Comparison
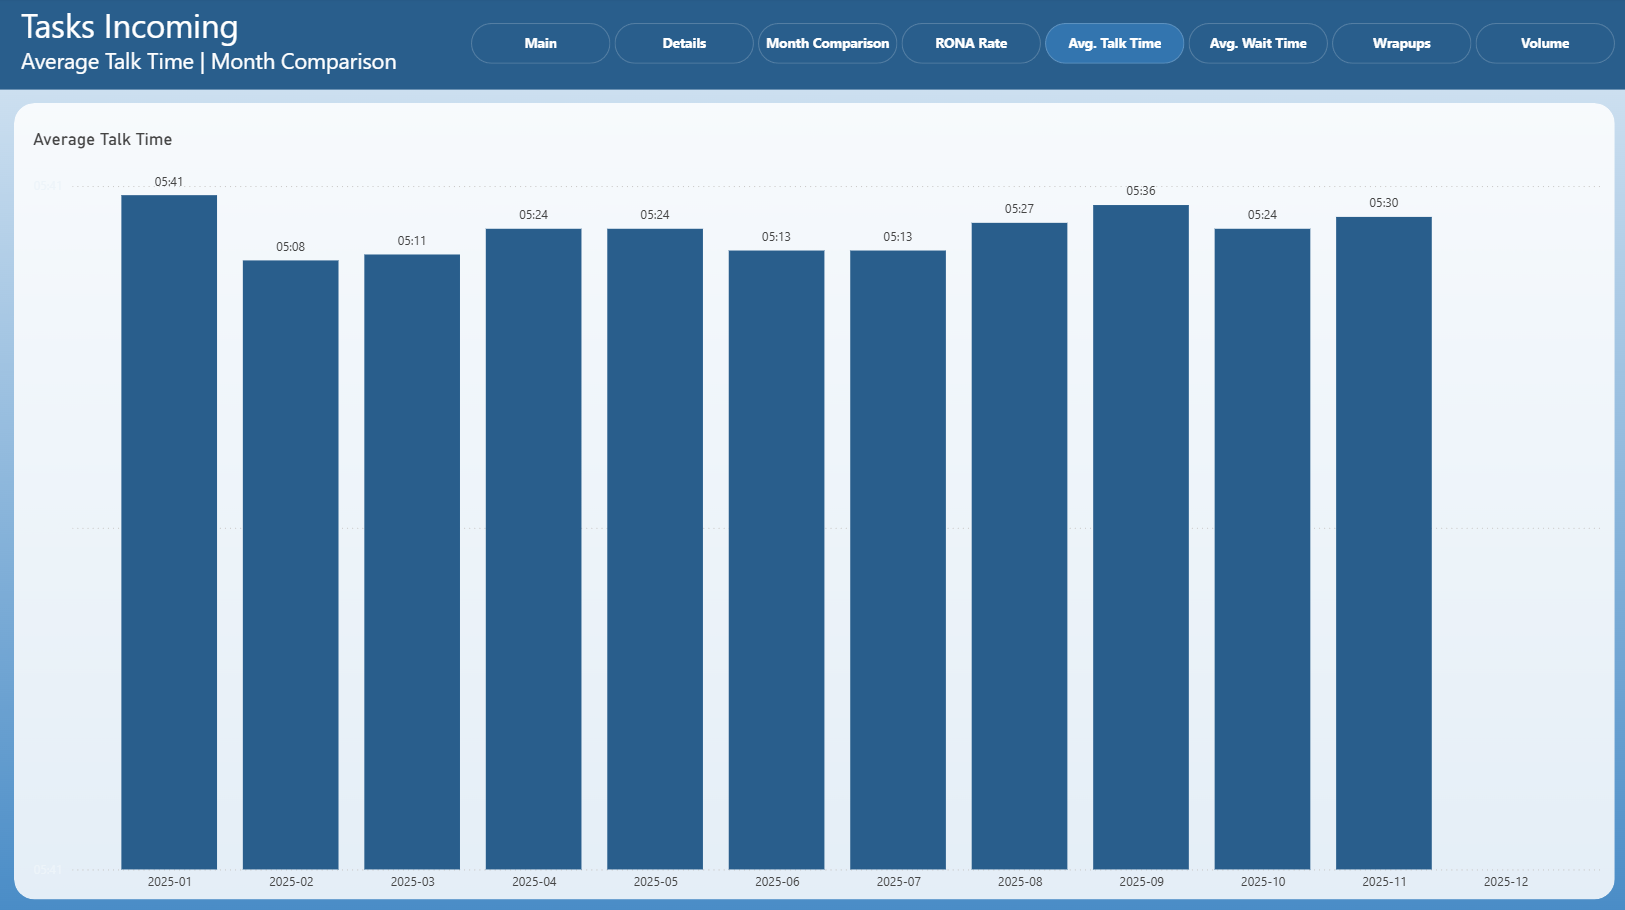
This page compares Average Talk Time for incoming tasks across months.
It is useful for:
monitoring conversation length trends,
identifying changes in customer interaction complexity,
supporting workforce planning and performance analysis.
Average Wait Time | Month Comparison
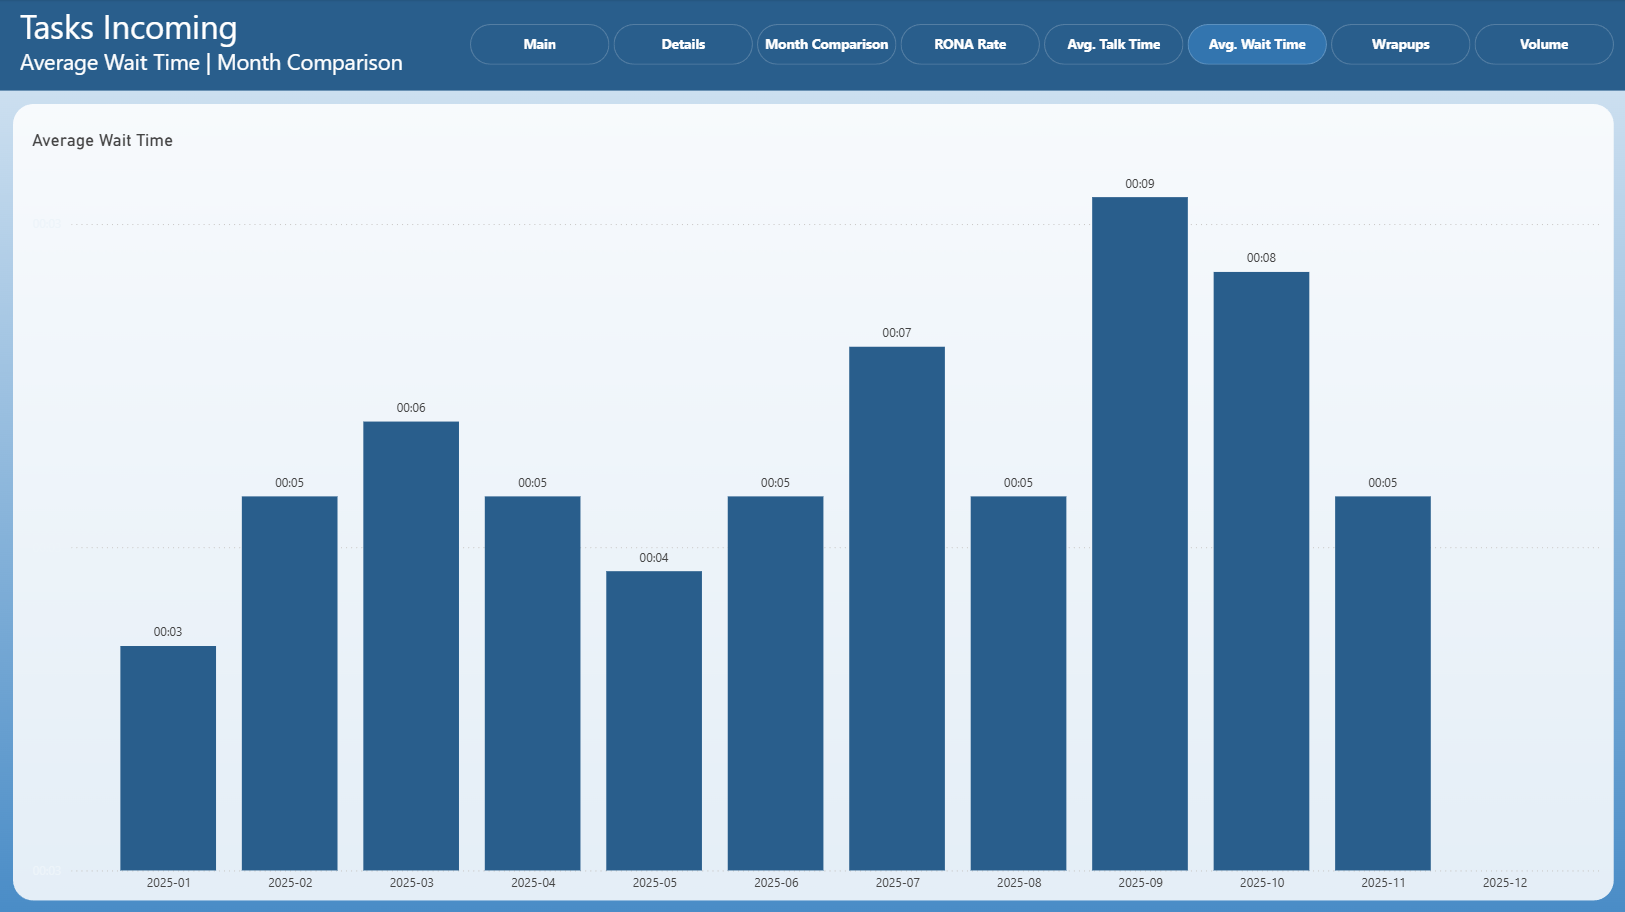
The Average Wait Time page shows how long customers waited before their tasks were accepted, compared across months.
It helps evaluate:
queue congestion,
staffing adequacy,
customer experience impact over time.
Wrapups
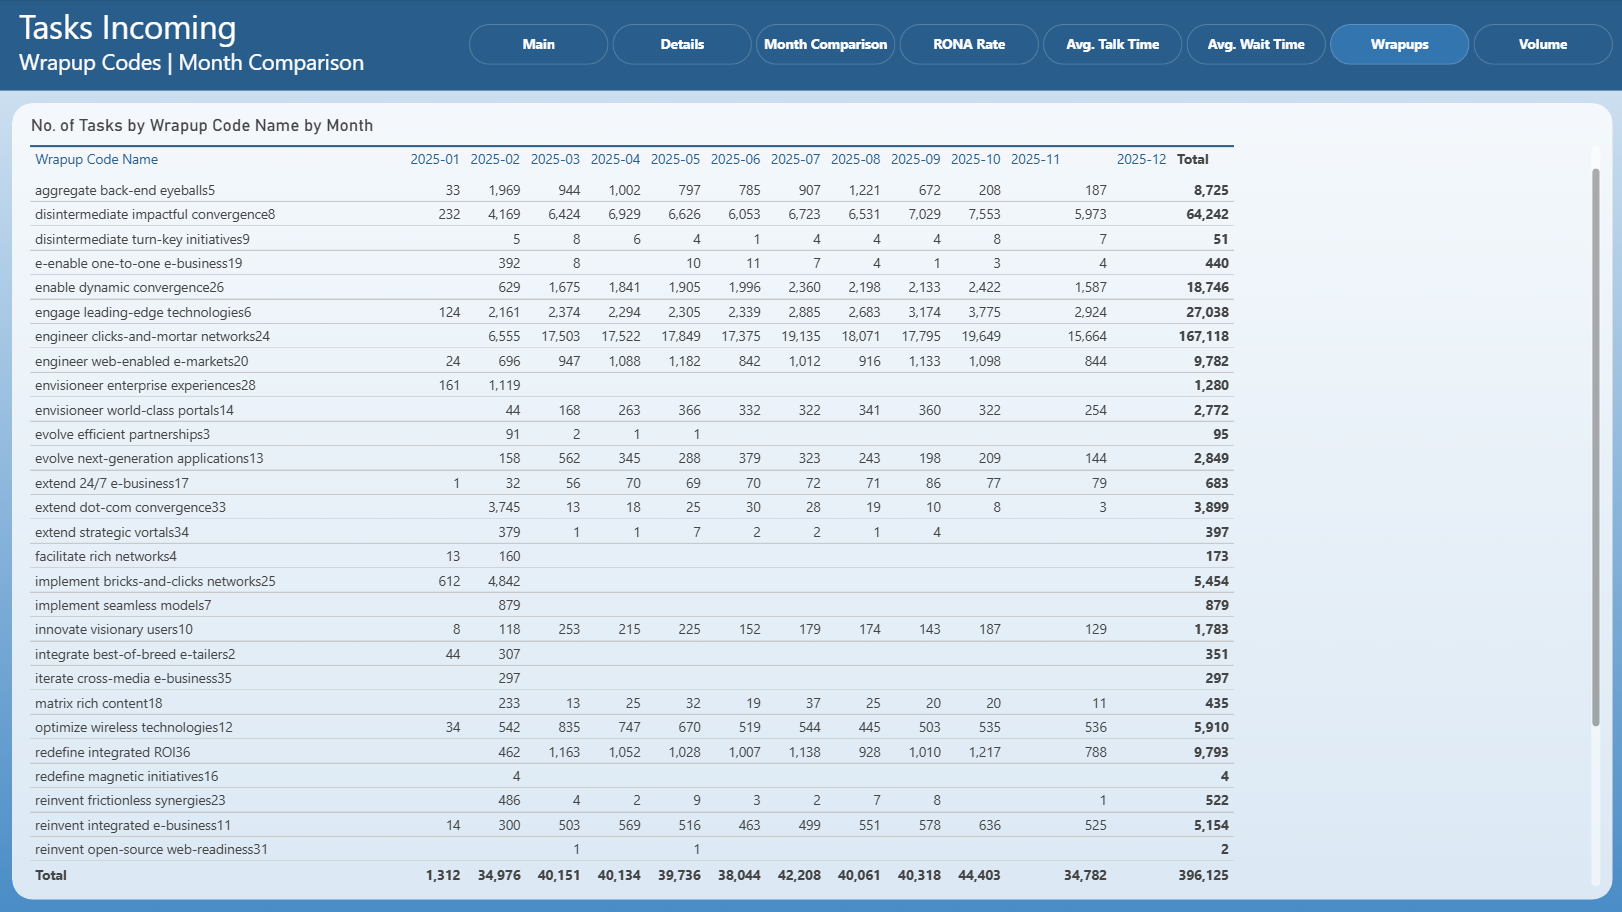
The Wrapups page presents incoming tasks grouped by wrapup code and month.
It provides insight into:
task outcomes,
reasons for task completion,
trends in post-interaction classification.
This page is often used for quality analysis and reporting.
Volume
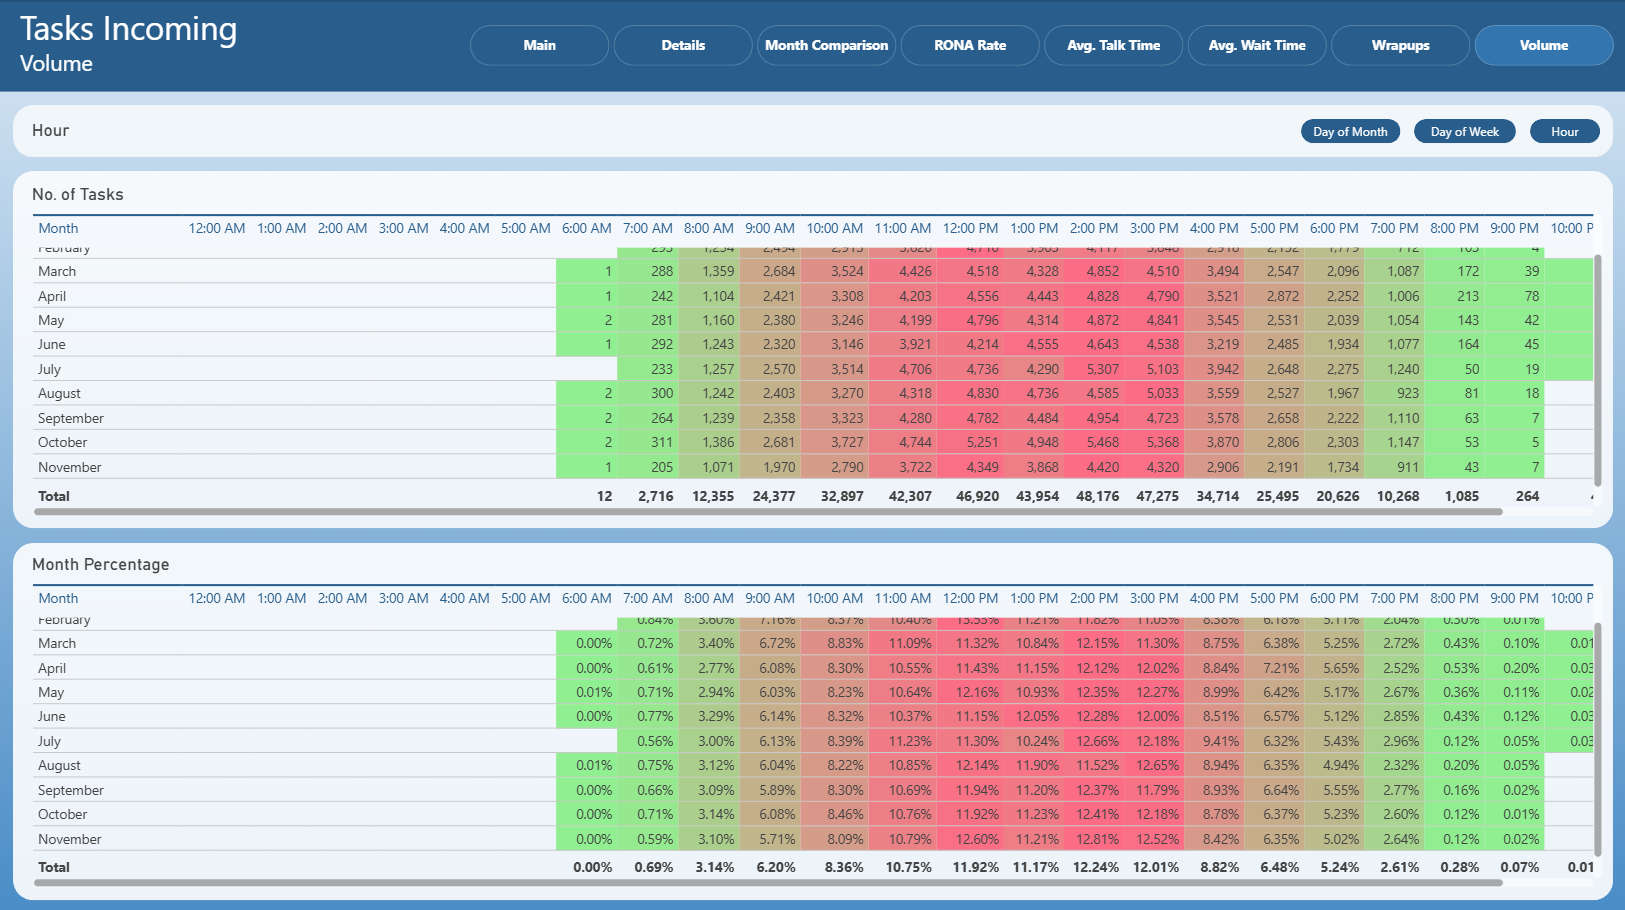
The Volume page shows incoming task volume distribution by time intervals.
It includes:
No. of Tasks – absolute task counts by hour.
Month Percentage – percentage distribution of tasks within each month.
This page is useful for identifying peak hours and optimizing staffing schedules.