Queue Performance
The Queue Performance report is an Interactive Report that provides a comprehensive overview of queue-level performance for the selected time period. It focuses on offered, accepted, abandoned interactions, service level metrics, queue durations, and wrap-up activity.
The report is intended for operational monitoring and performance analysis of queues across different time dimensions.
Available Pages
The Queue Performance report consists of the following pages:
Main
Volume
Wrapups
Statistics
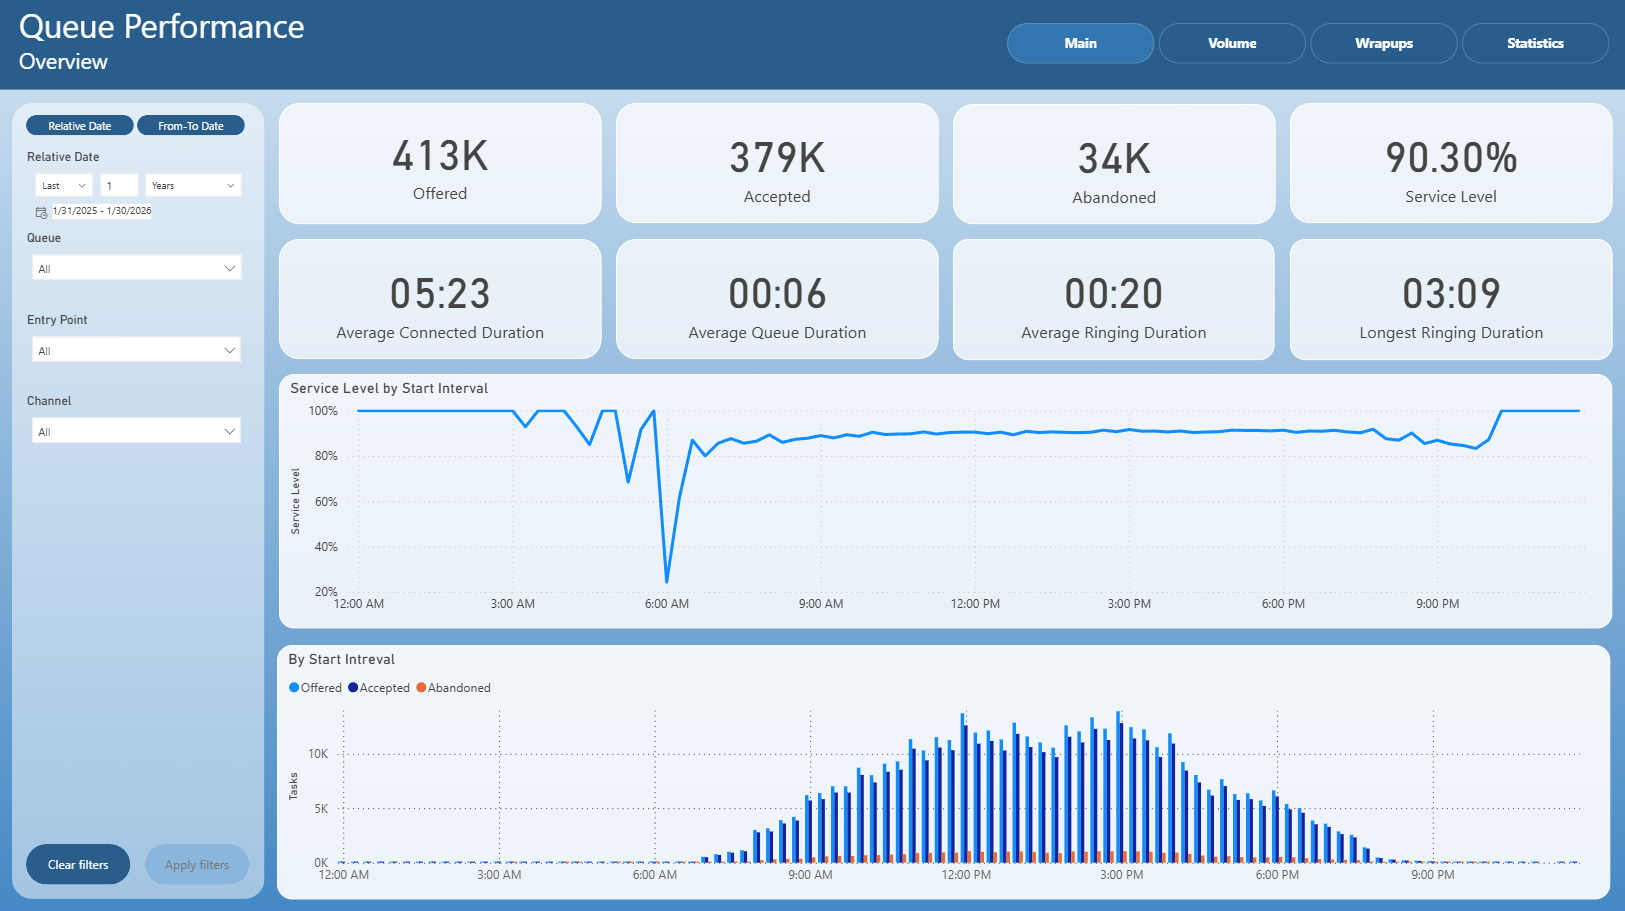
Main
The Main page provides a high-level overview of queue performance and key service metrics.
It includes:
Total number of offered and accepted interactions
Number of abandoned interactions
Overall service level
Average connected, queue, and ringing durations
Longest ringing duration
Service level trend by start interval
Distribution of offered, accepted, and abandoned tasks by start interval
This page is intended for quick assessment of overall queue performance and service level behavior during the day.
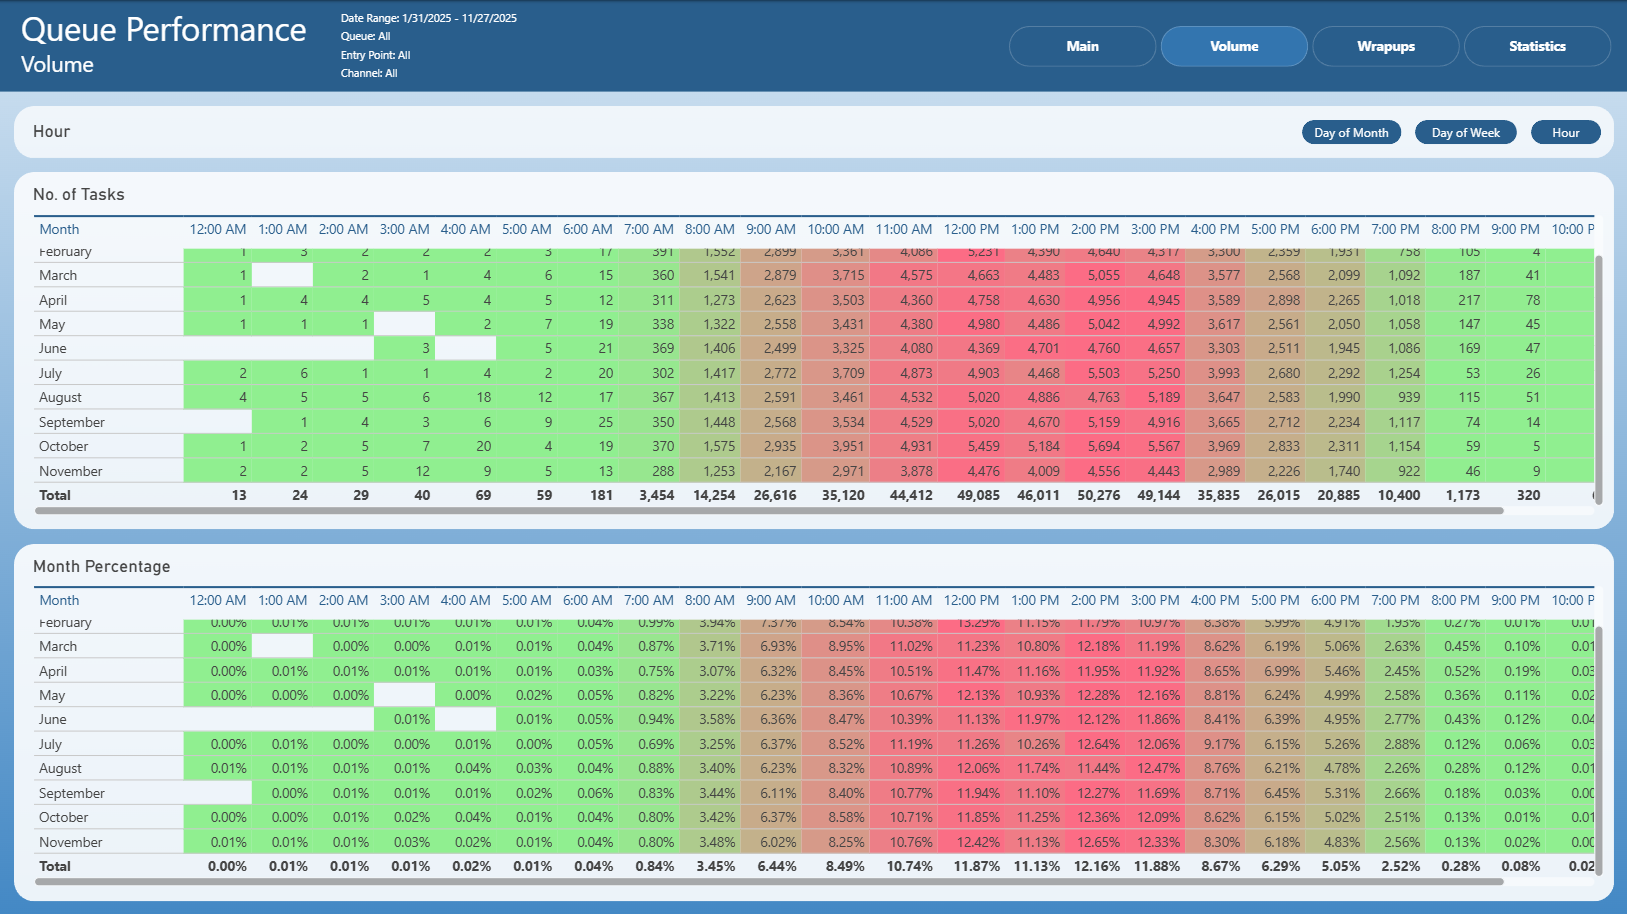
Volume
The Volume page focuses on interaction volume distribution over time.
It presents:
Number of tasks by hour
Hourly distribution broken down by month
Percentage-based volume distribution by hour
Heatmap-style visualization highlighting peak and low traffic periods
This page helps identify daily and hourly traffic patterns and volume concentration.
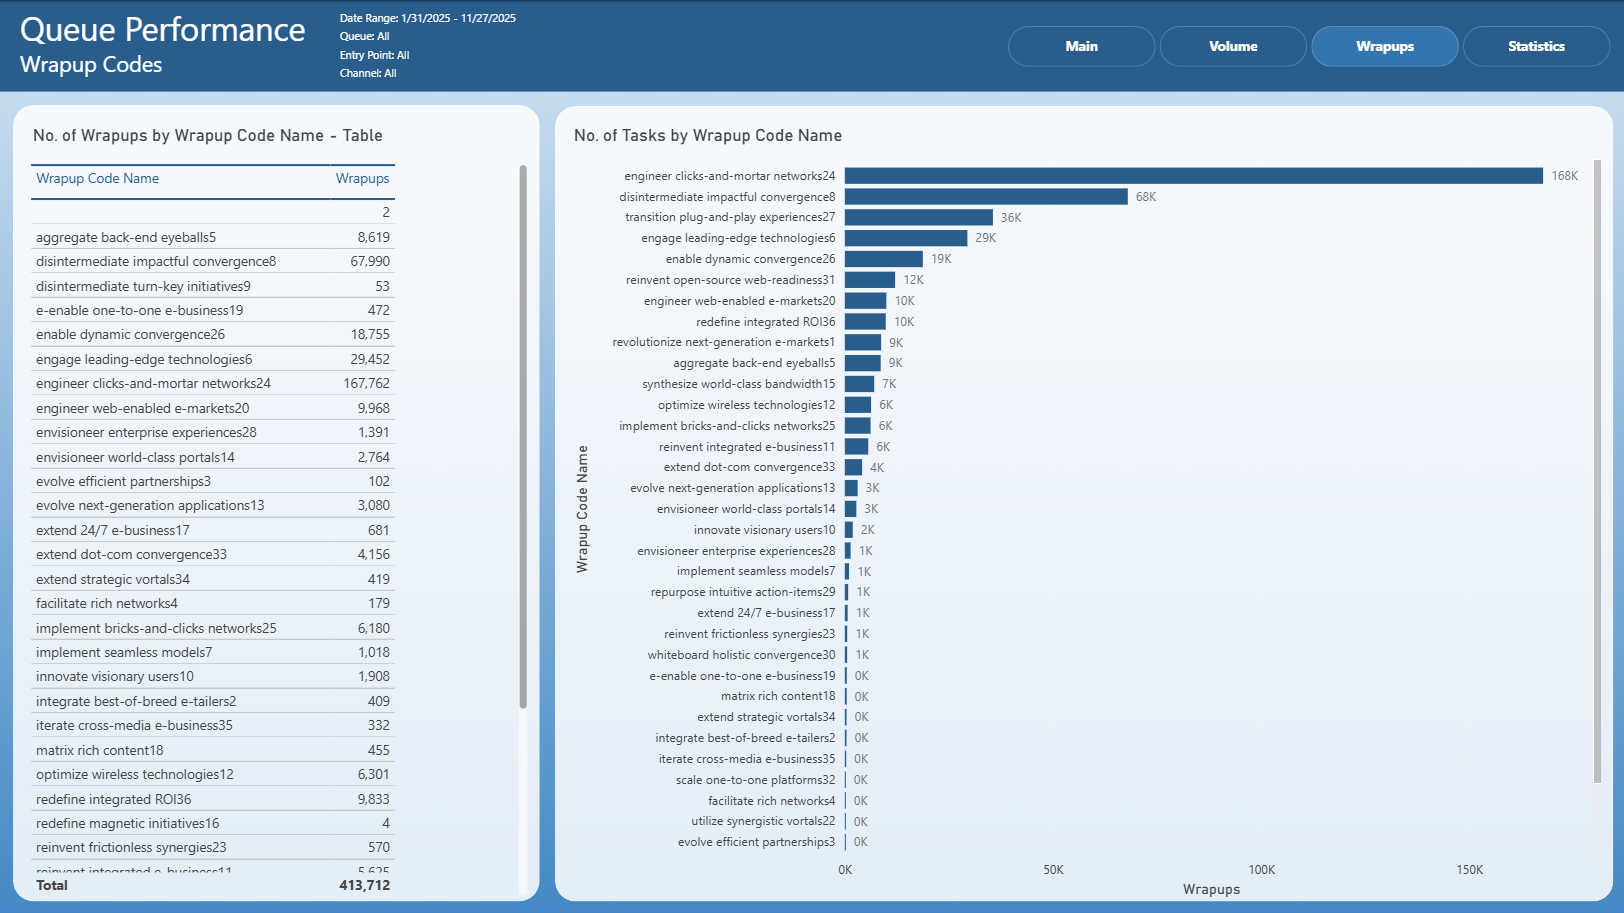
Wrapups
The Wrapups page provides insight into wrap-up code usage within queues.
It includes:
Number of wrap-ups by wrap-up code in a table format
Visual comparison of wrap-up code volumes using a bar chart
Identification of most frequently used wrap-up codes
This page is useful for analyzing post-interaction handling and categorization behavior.
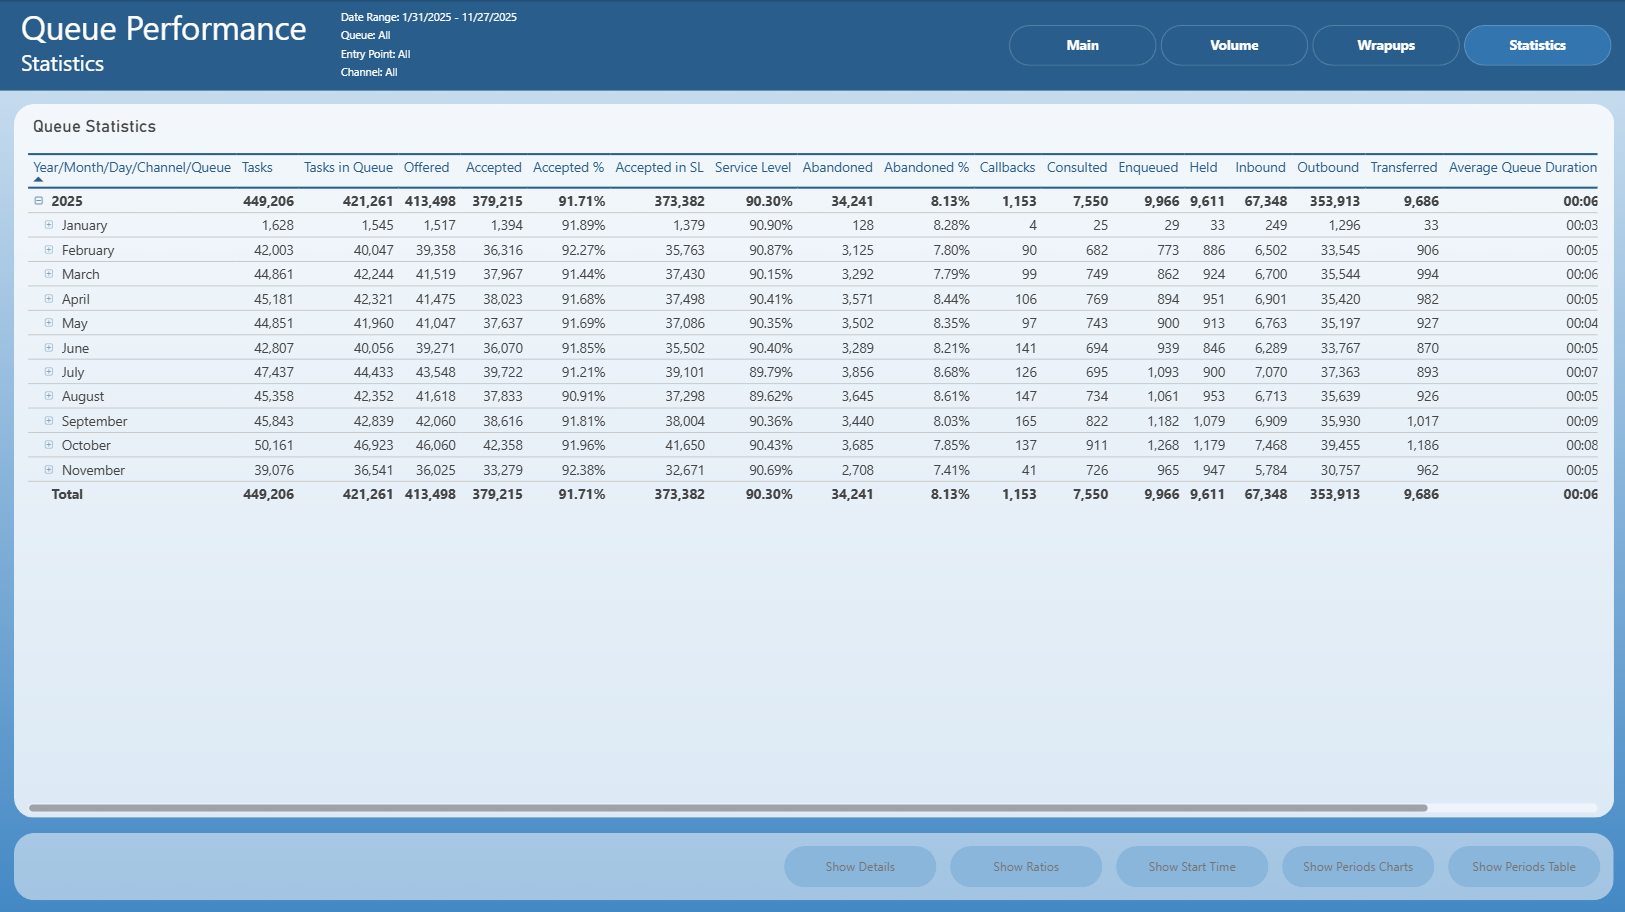
Statistics
The Statistics page delivers detailed aggregated queue statistics in a tabular format.
It includes:
Tasks, offered, accepted, and accepted-in-SL counts
Service level and abandonment metrics
Callbacks, consulted, enqueued, held, inbound, outbound, and transferred values
Average queue duration
Hierarchical breakdown by year and month
This page is intended for detailed reporting, drill-through analysis, and historical comparison.
Notes
This is an Interactive Report
All pages respect the applied filters
Drill-through actions may be available from selected visuals and tables
Exporting follows standard Power BI export behavior