Team Performance
The Team Performance report is an Interactive Report focused on evaluating overall team-level performance across the contact center. It provides insights into offered, accepted, and abandoned tasks, service quality indicators, task volumes, wrapup usage, and detailed task-level data.
The report is designed primarily for team leaders, supervisors, and operations managers who need to monitor performance trends, identify bottlenecks, and compare workload distribution across time.
Available Pages
The Team Performance report consists of the following pages:
Main
Volume
Wrapups
Details
Main
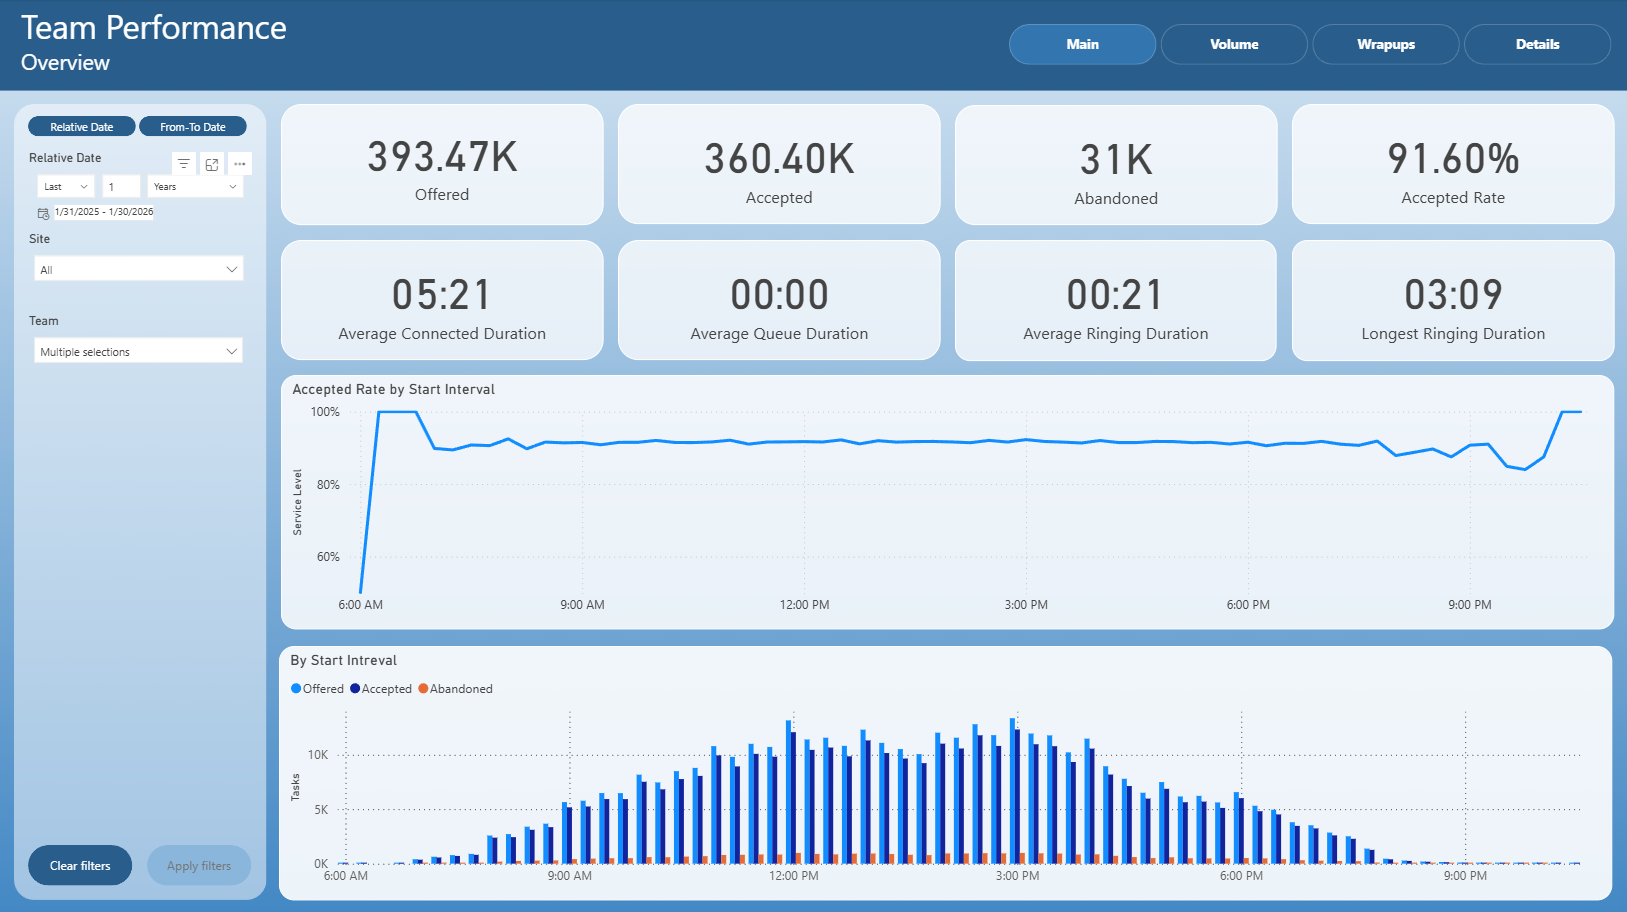
The Main page provides a high-level overview of team performance for the selected time period.
It includes several key KPI tiles that summarize overall activity:
Offered – total number of tasks offered to teams
Accepted – total number of tasks successfully accepted
Abandoned – number of tasks abandoned before being handled
Accepted Rate – percentage of accepted tasks relative to offered tasks
Average Connected Duration – average time agents were connected with customers
Average Queue Duration – average time tasks spent waiting in a queue
Average Ringing Duration – average ringing time before acceptance
Longest Ringing Duration – maximum observed ringing duration
Below the KPIs, the page contains trend and distribution visuals:
Accepted Rate by Start Interval – a line chart showing how acceptance rate evolves throughout the day
By Start Interval – a bar chart comparing the number of offered, accepted, and abandoned tasks across time intervals
This page is mainly used for quick health checks and identifying peak hours or potential service issues.
Volume
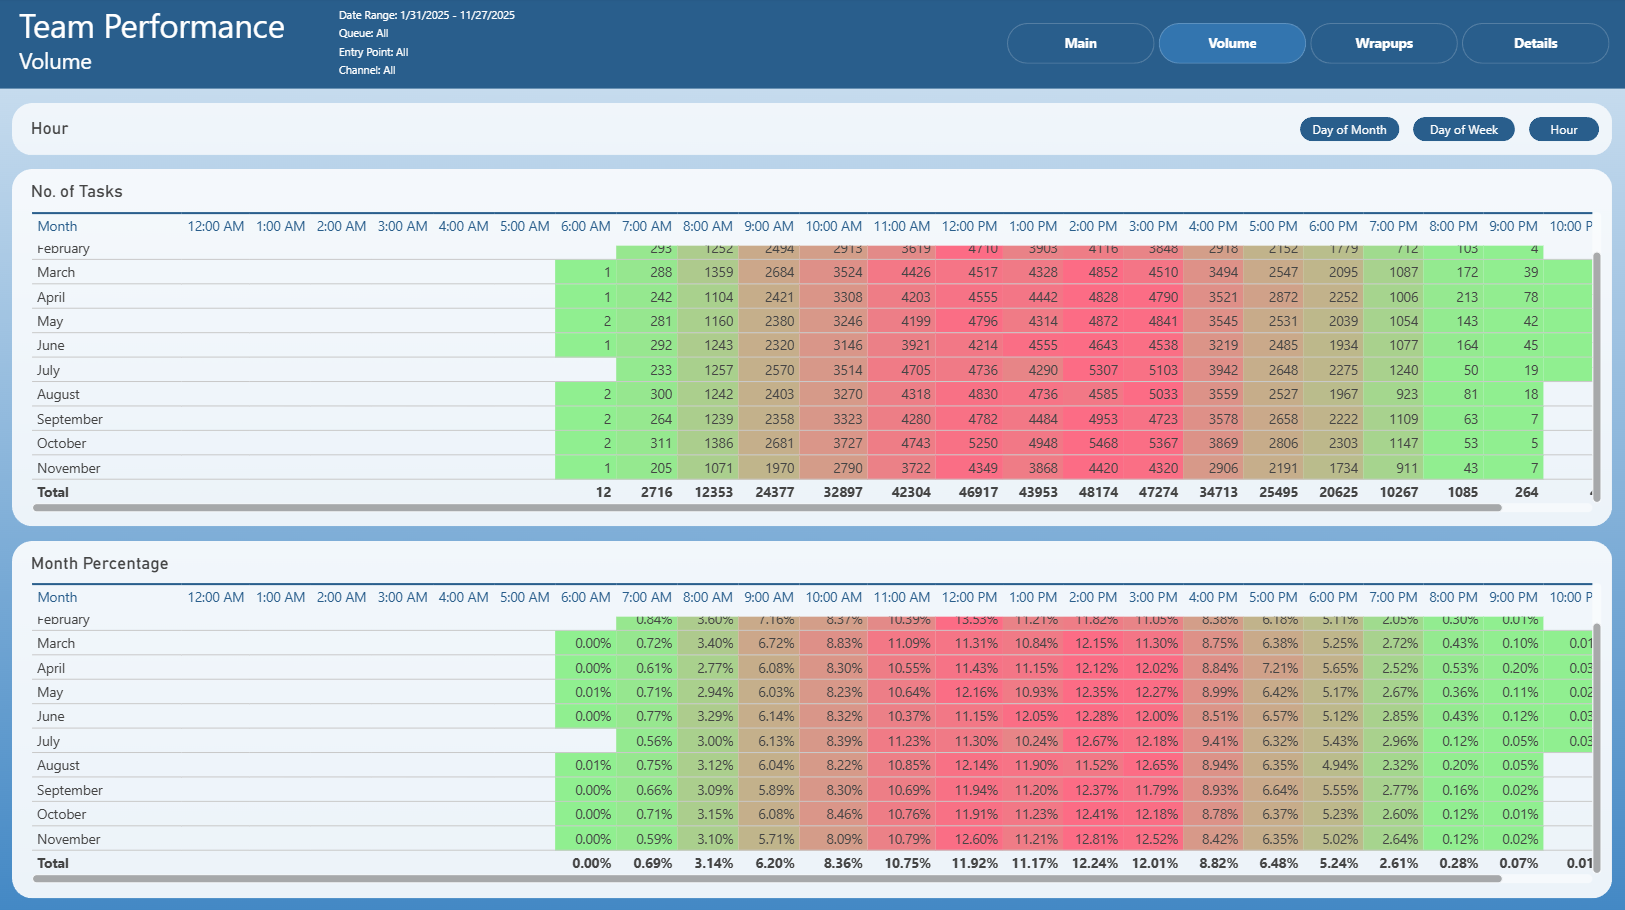
The Volume page focuses on the distribution of task volumes over time.
It presents:
A heatmap-style table showing the number of tasks by hour, broken down by month
A corresponding percentage distribution table, showing how each hour contributes to the total monthly volume
The page supports multiple aggregation modes (for example by hour, day of week, or day of month), allowing users to:
Identify peak workload periods
Compare volume patterns between months
Support staffing and capacity planning decisions
This page is especially useful for workforce planning and trend analysis.
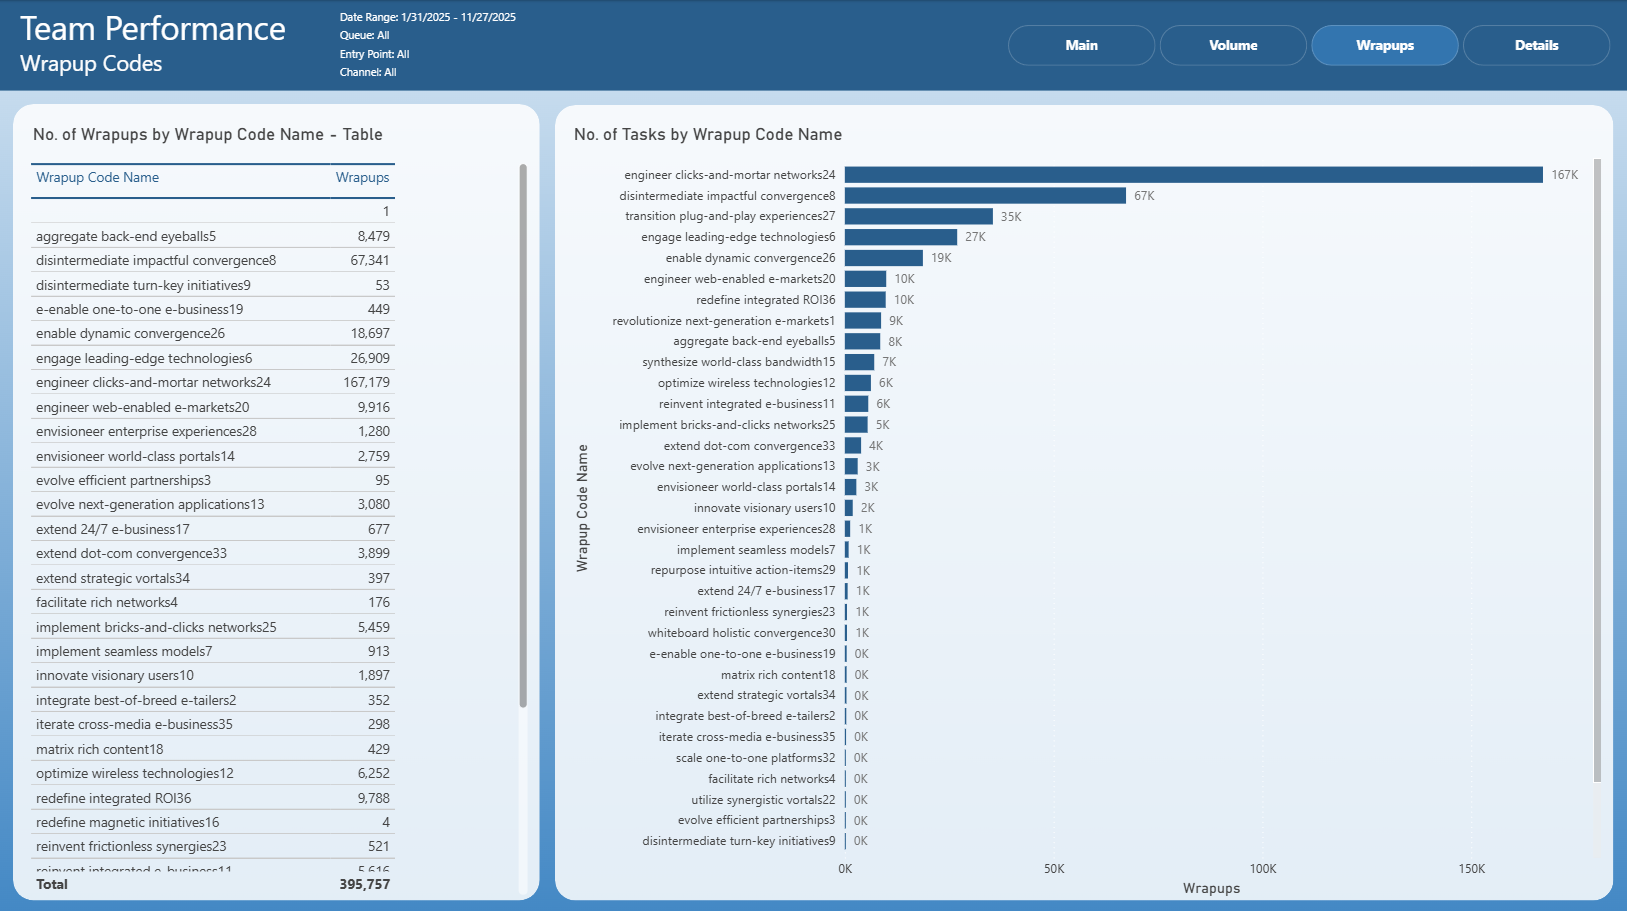
Wrapups
The Wrapups page analyzes wrapup code usage across teams.
It contains:
A table showing the number of wrapups per wrapup code
A bar chart visualizing the distribution of tasks by wrapup code, sorted by volume
This page helps to:
Understand the most common outcomes or resolutions of tasks
Identify dominant task types or customer issues
Validate wrapup code usage consistency across teams
It is typically used for process analysis, reporting, and quality management.
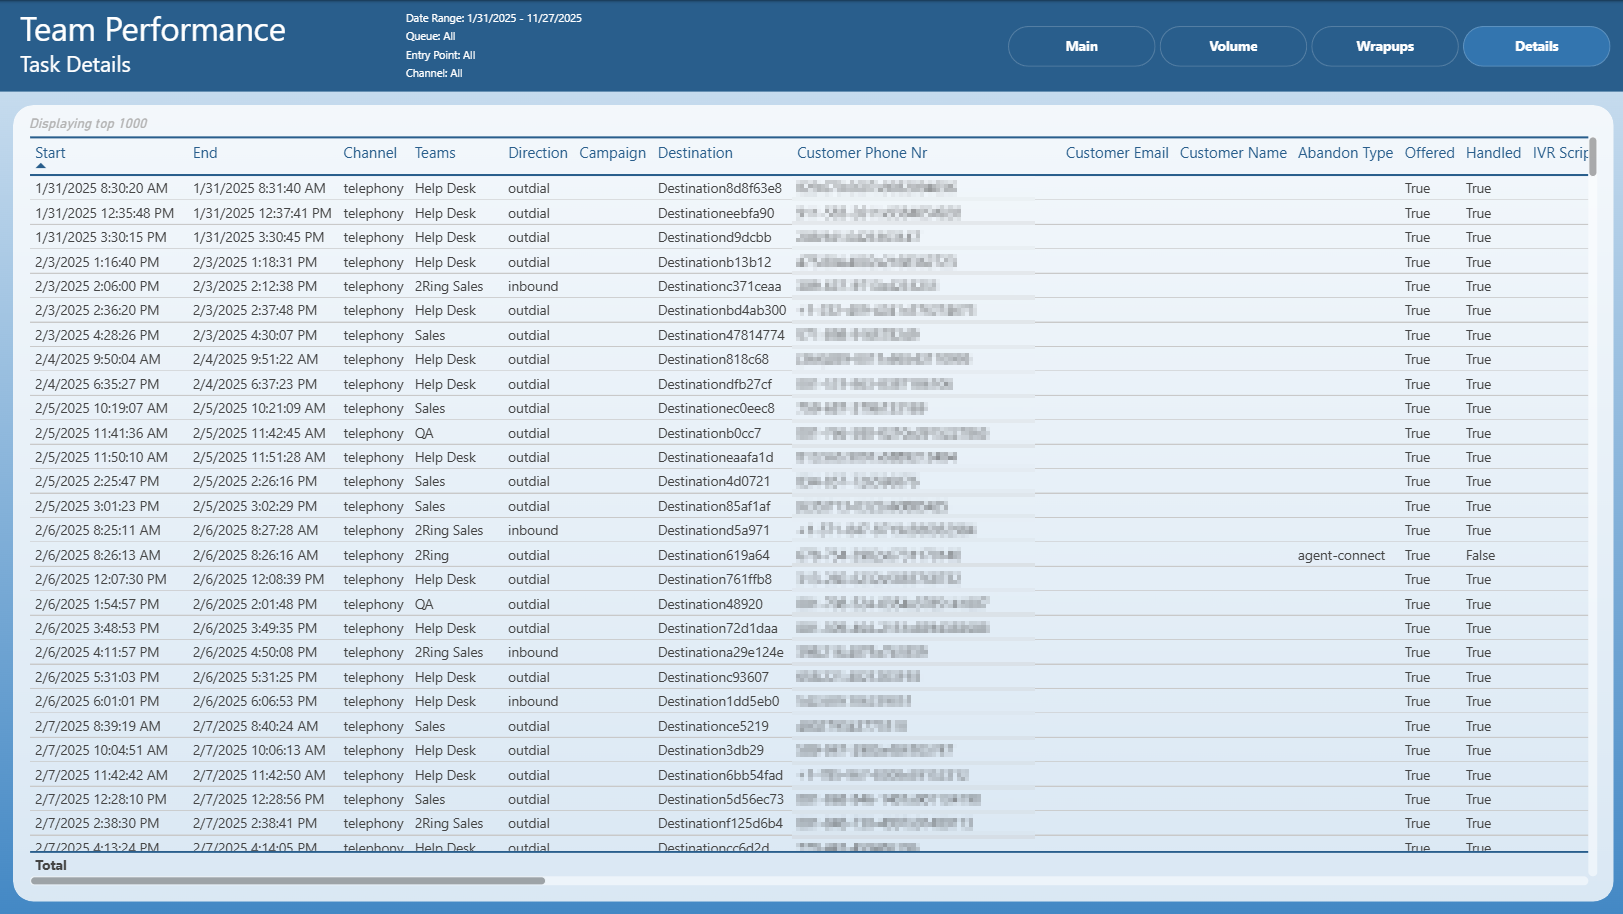
Details
The Details page provides a detailed, task-level view of all interactions included in the report.
It displays a table with attributes such as:
Start and end timestamps
Channel
Team
Direction (inbound / outbound)
Campaign and destination
Customer identifiers (phone number, email, name)
Abandon type
Flags indicating whether the task was offered and handled
IVR script information
This page is intended for deep-dive analysis, validation of KPIs, and investigation of specific tasks or anomalies observed on summary pages.