Tasks Handled
The Tasks Handled report is an Interactive Report that provides a comprehensive overview of tasks successfully handled within the selected time period.
It focuses on task volume, distribution across organizational dimensions, detailed task-level records, and time-based performance metrics such as average talk time and wait time.
This report is primarily intended for operational monitoring, workload analysis, and performance evaluation.
Available Pages
The Tasks Handled report consists of the following pages:
Main
Details
Month Comparison
Avg. Talk Time
Avg. Wait Time
Volume
Main
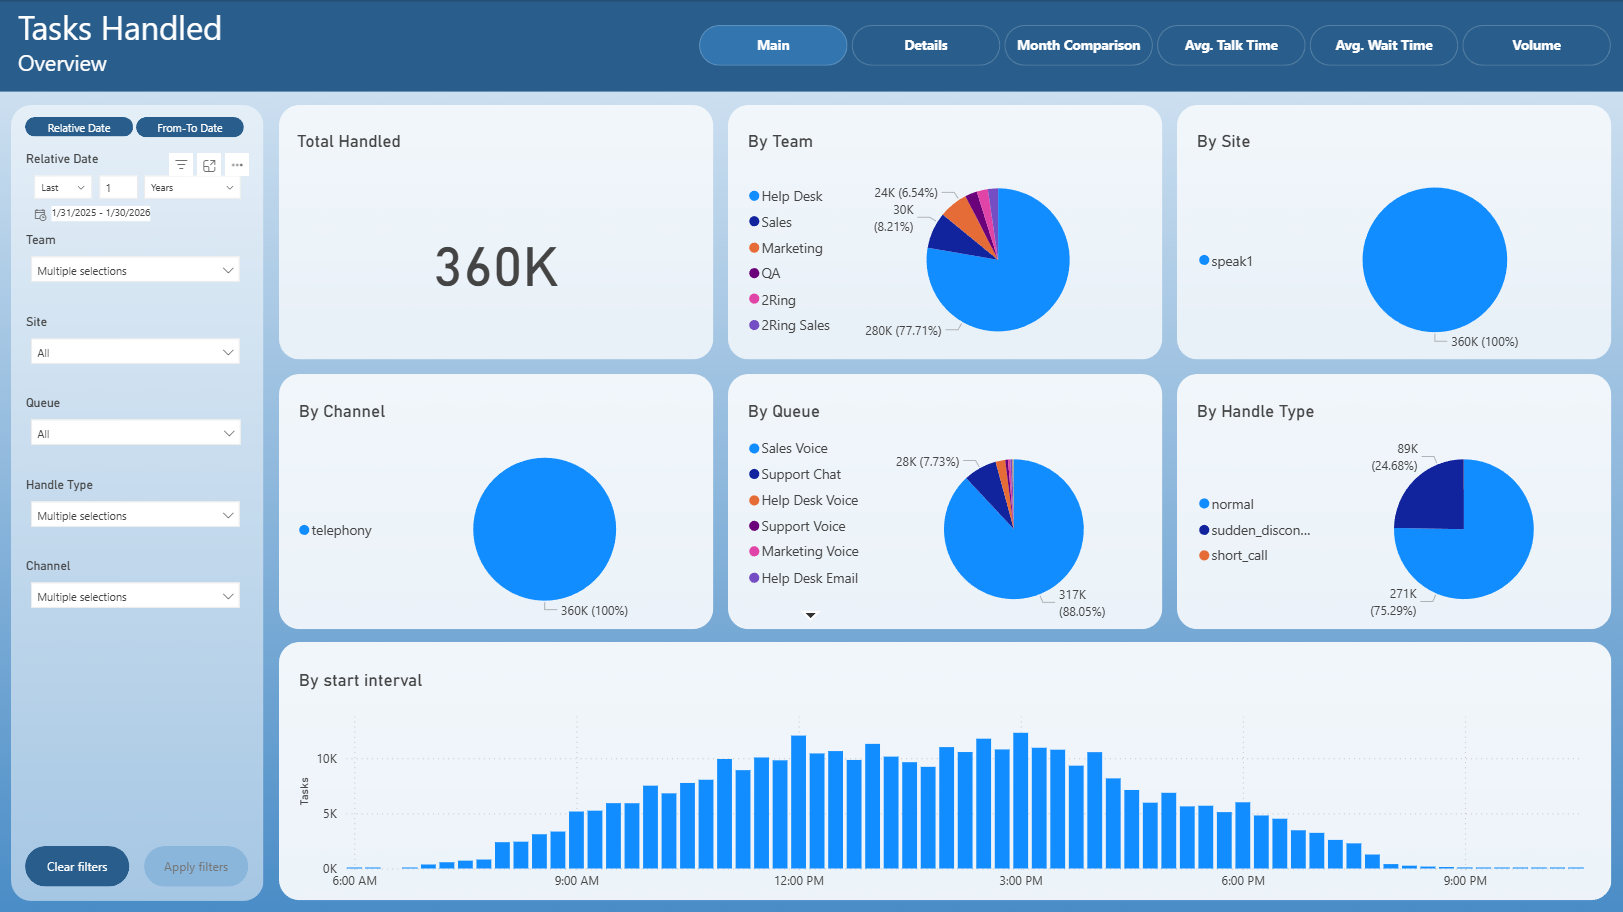
The Main page provides a high-level summary of handled tasks.
It includes:
Total number of handled tasks
Distribution of handled tasks by team
Team
Site
Channel
Queue
Handle Type
Task volume by start interval, showing how handled tasks are distributed throughout the day
This page is typically used for a quick operational overview and trend identification.
Details
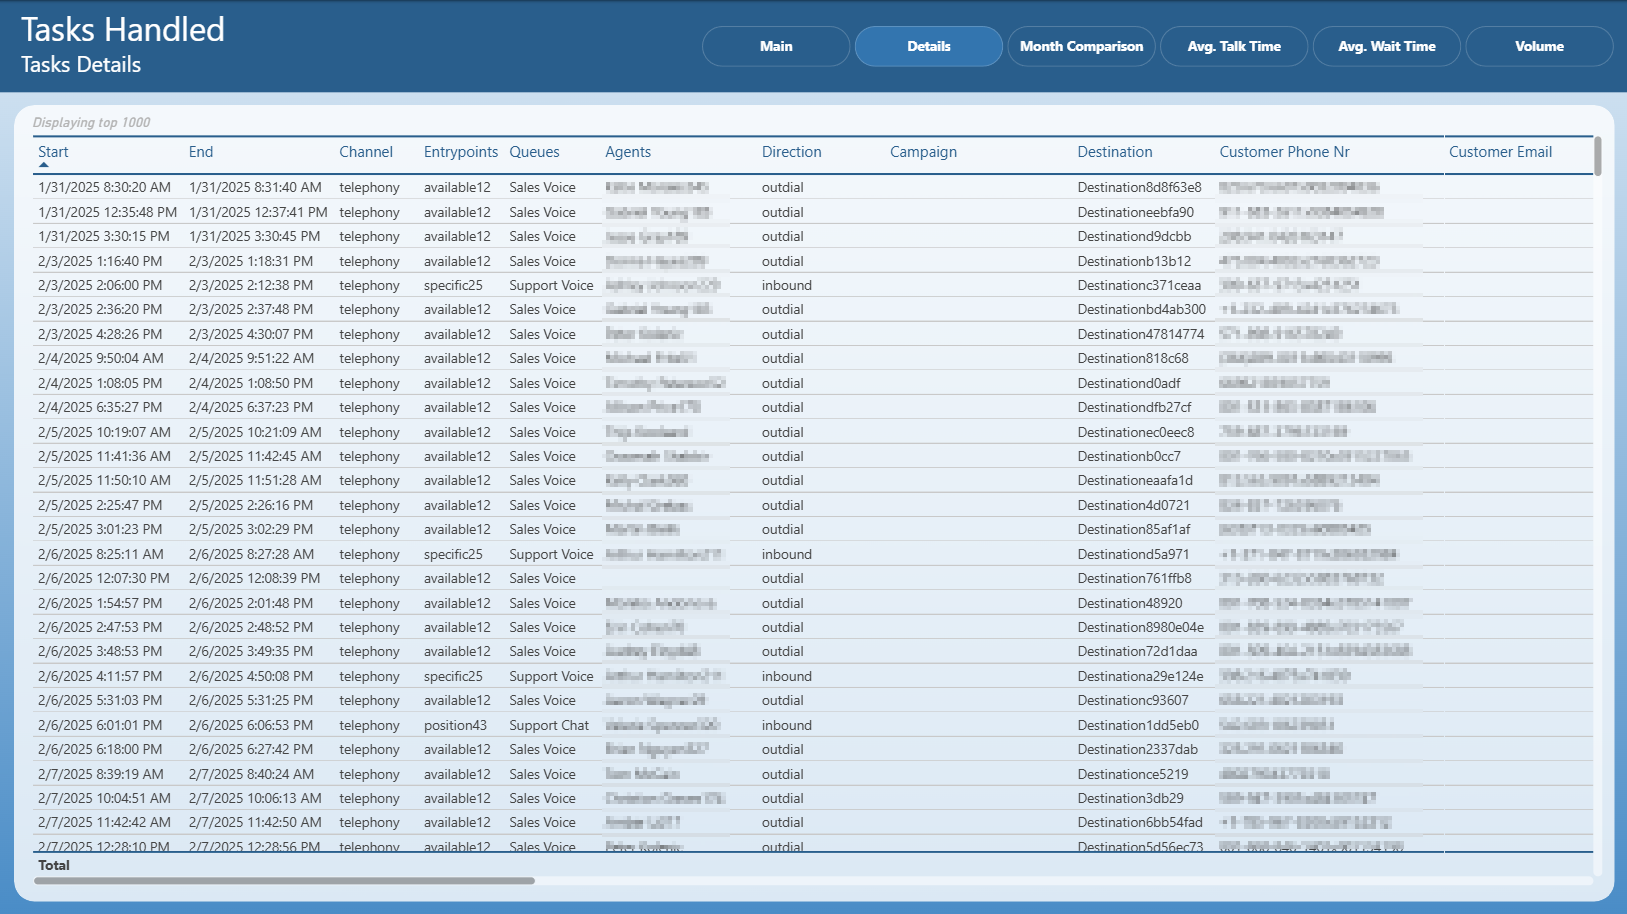
The Details page displays a detailed table of individual handled tasks.
Each row represents a single task and includes:
Start and end time
Channel
Entry point
Queue
Assigned agent
Direction (inbound / outbound)
Campaign
Destination
Customer contact details (where available)
This page is intended for in-depth task-level analysis and investigation.
Month Comparison
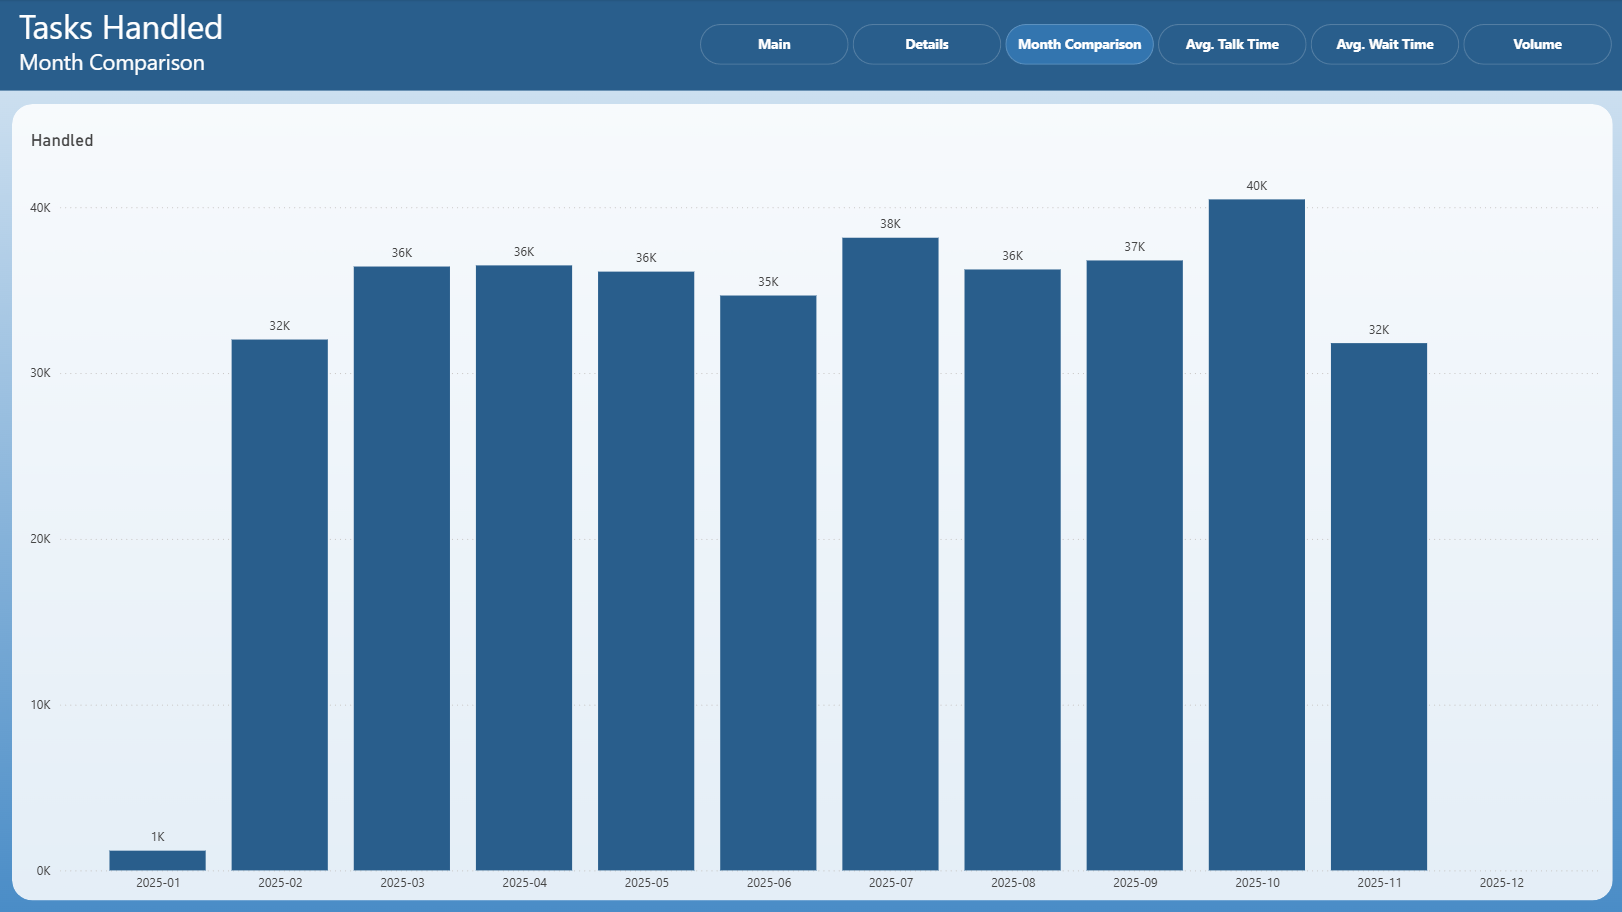
The Month Comparison page compares the number of handled tasks across months.
It allows users to:
Identify month-over-month changes in handled task volume
Detect trends, growth, or decline in workload over time
This page is useful for longer-term performance evaluation.
Avg. Talk Time
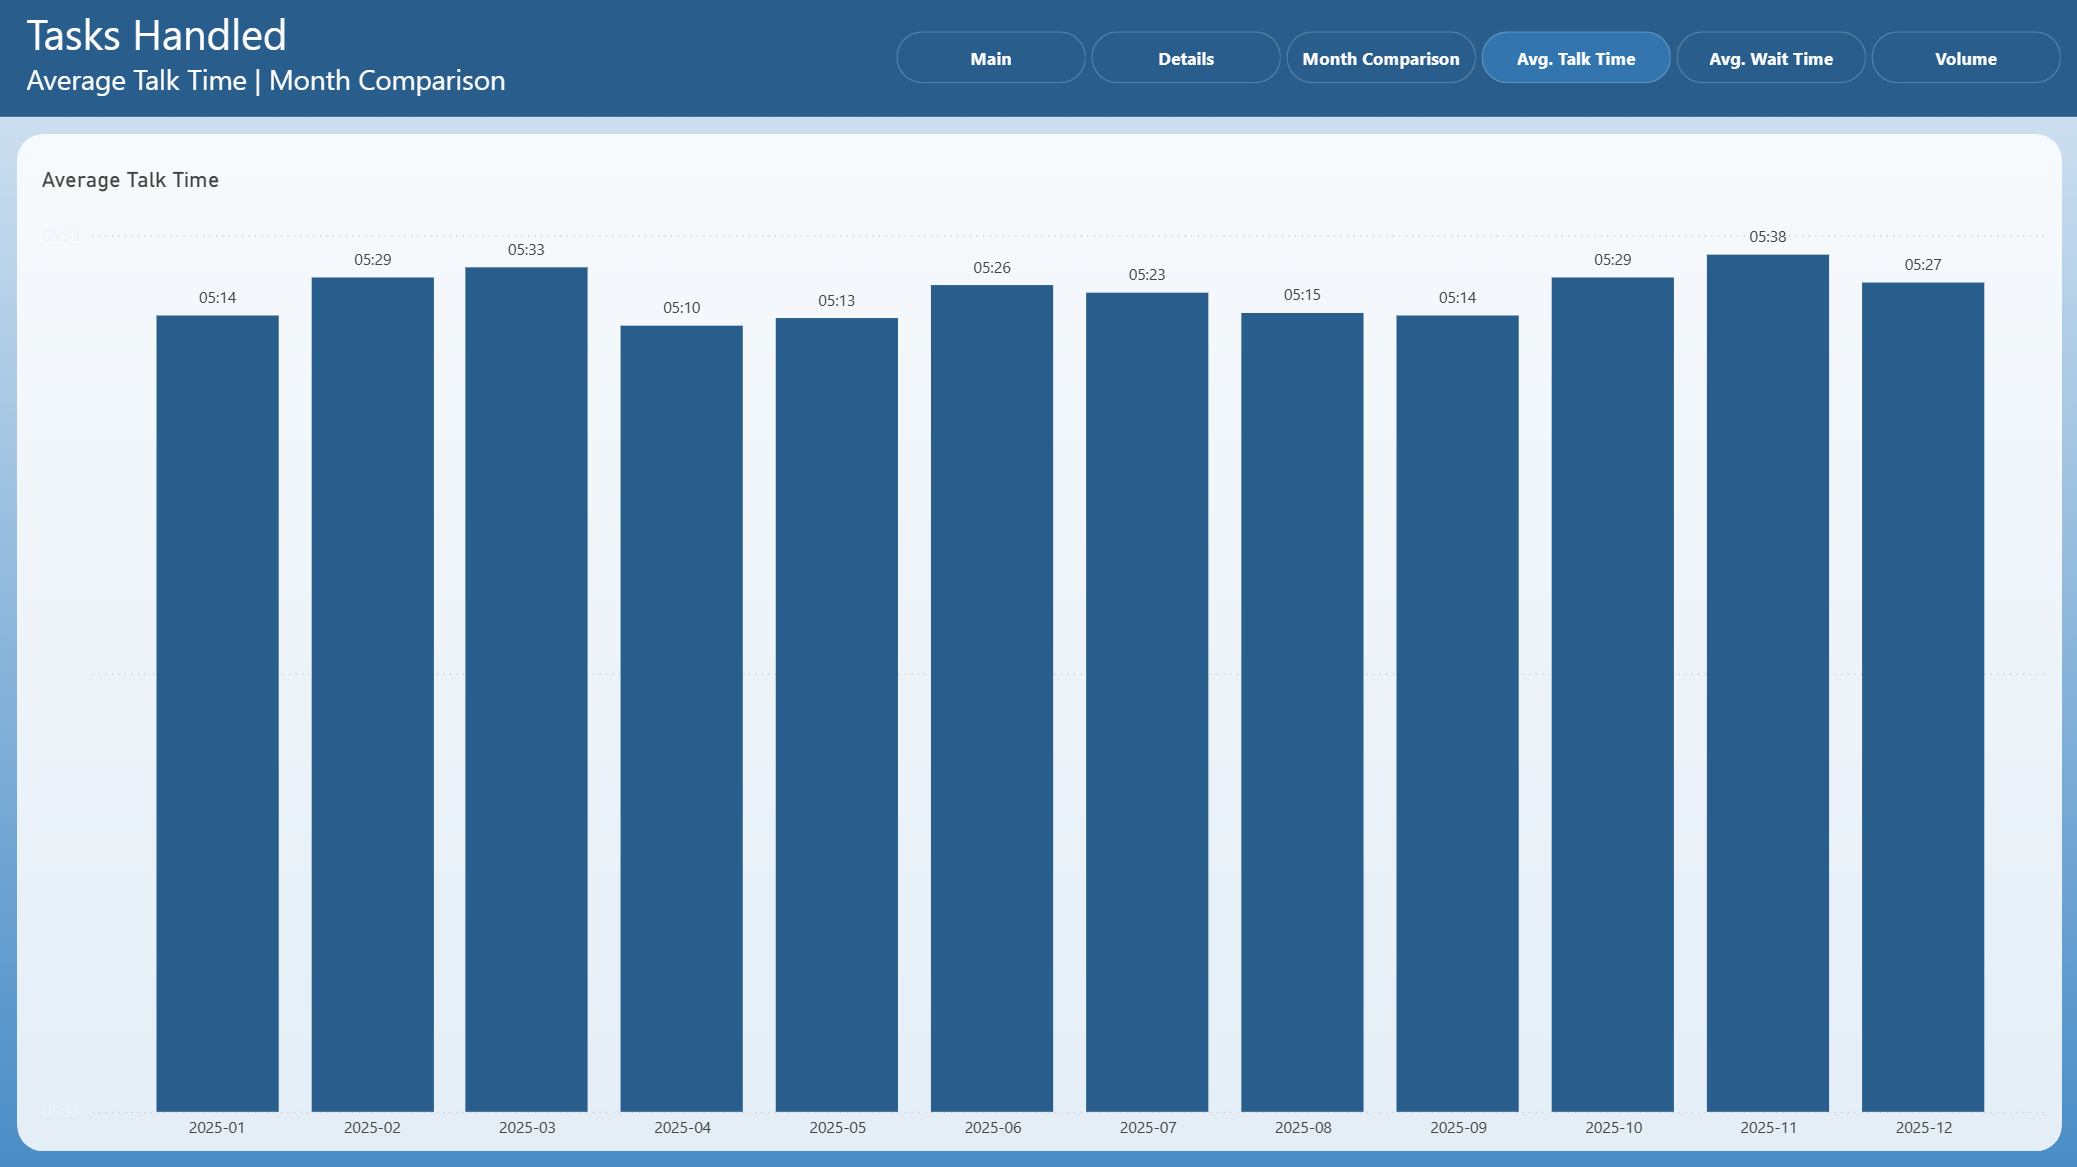
The Avg. Talk Time page shows the average talk time comparison across months.
It helps to:
Monitor changes in average call handling duration
Identify efficiency trends in task handling
Avg. Wait Time
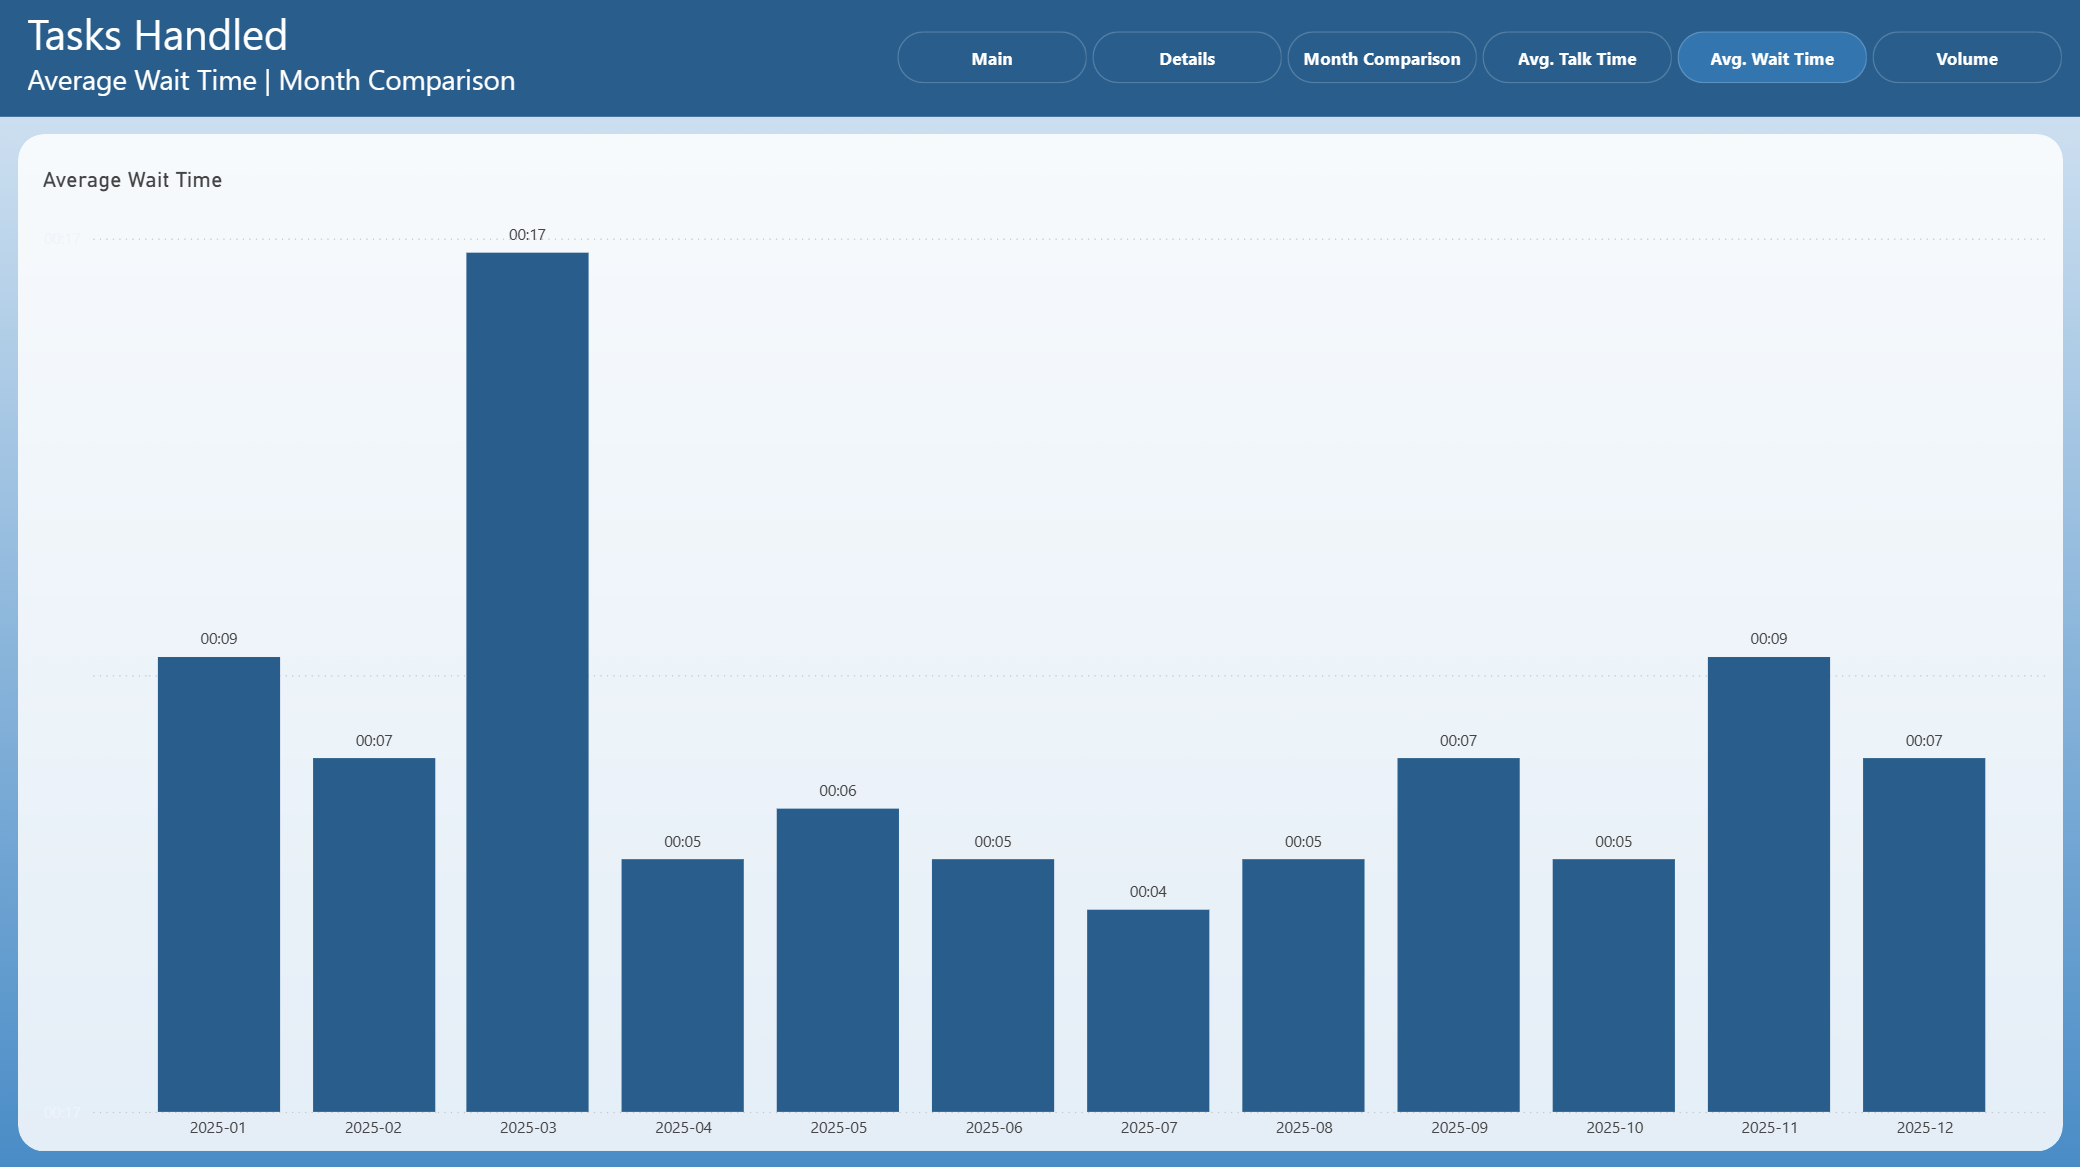
The Avg. Wait Time page displays the average customer wait time across months.
It allows users to:
Track changes in customer waiting experience
Identify periods with increased wait times
Volume
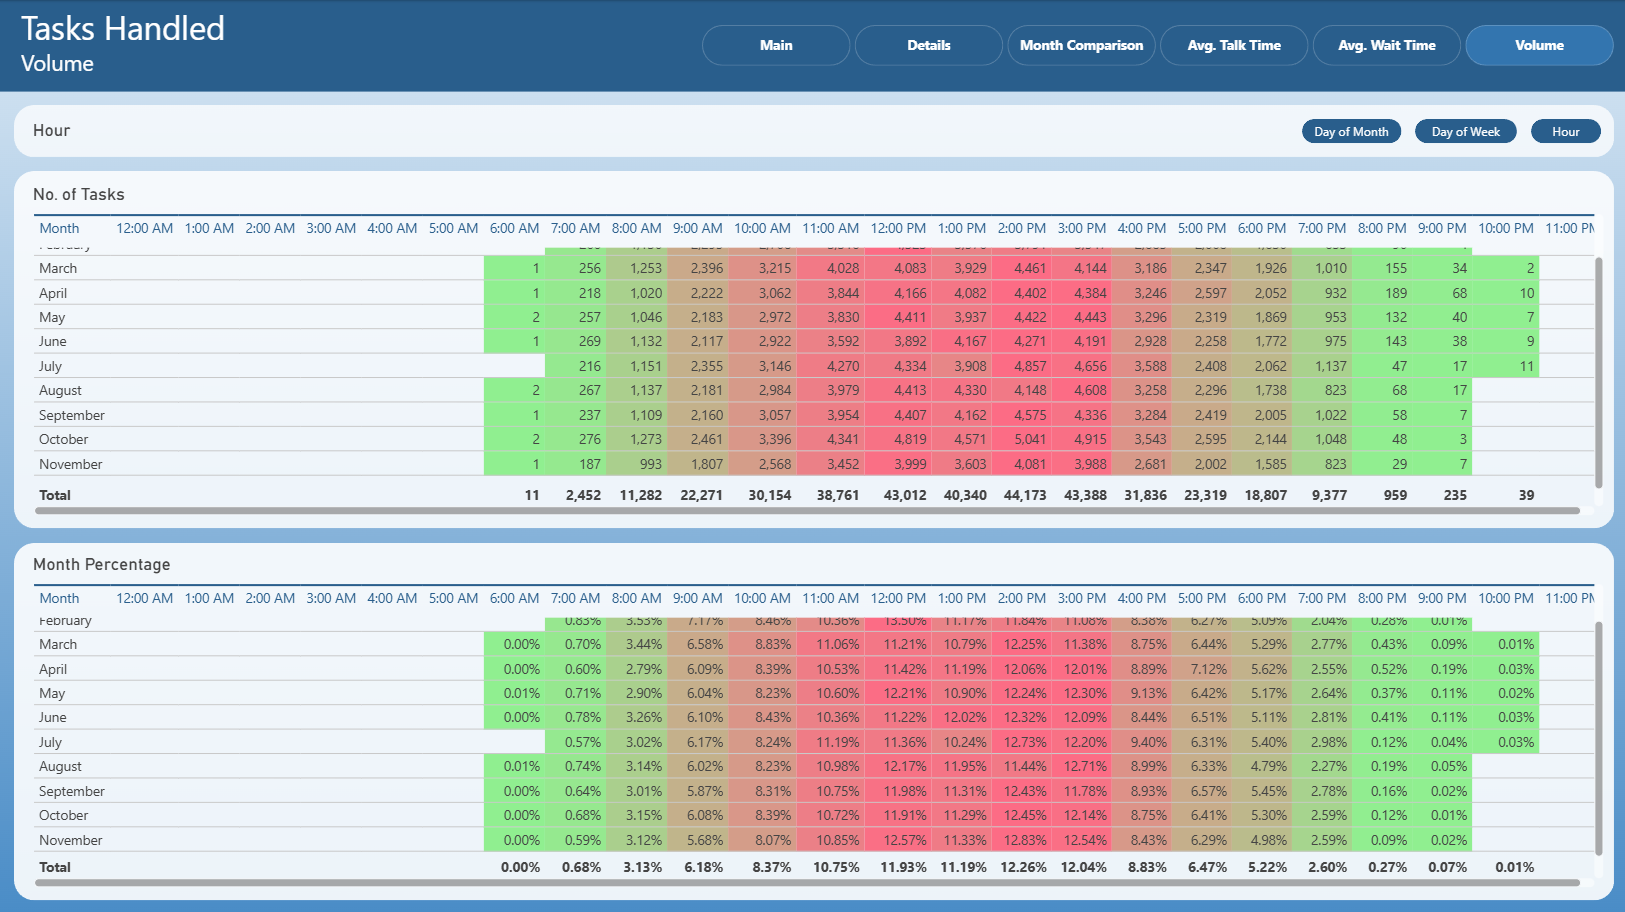
The Volume page provides a detailed time-based breakdown of handled task volume.
It includes:
Hourly distribution of handled tasks
Heatmap-style views showing task concentration by:
Hour of day
Day of week
Day of month
This page is useful for capacity planning and workload optimization.